Since 2016, with Canada's first national climate plan and the ratification of the international Paris Agreement, urgent collective actions to address climate change and limit global warming have been gaining momentum. Reducing emissions is key to Canada's plan for a healthy environment and economy and building a sustainable future. To continue reducing emissions, scientists and policymakers need to understand where greenhouse gas pollution comes from.
The National Inventory Report-a yearly report required by the United Nations Framework Convention on Climate Change and the Paris Agreement-tracks emissions from all sectors of the Canadian economy. Over the years, these reports have allowed governments, civil society, and the public to assess Canada's emissions profile and develop policies, technologies, and methods to further reduce our emissions.
Environment and Climate Change Canada published Canada's 2024 National Inventory Report on May 2, 2024. This report details emissions from seven greenhouse gases (GHGs) produced by the Canadian economy from January 1, 1990, to December 31, 2022. Canada has published an annual national inventory since 1996.
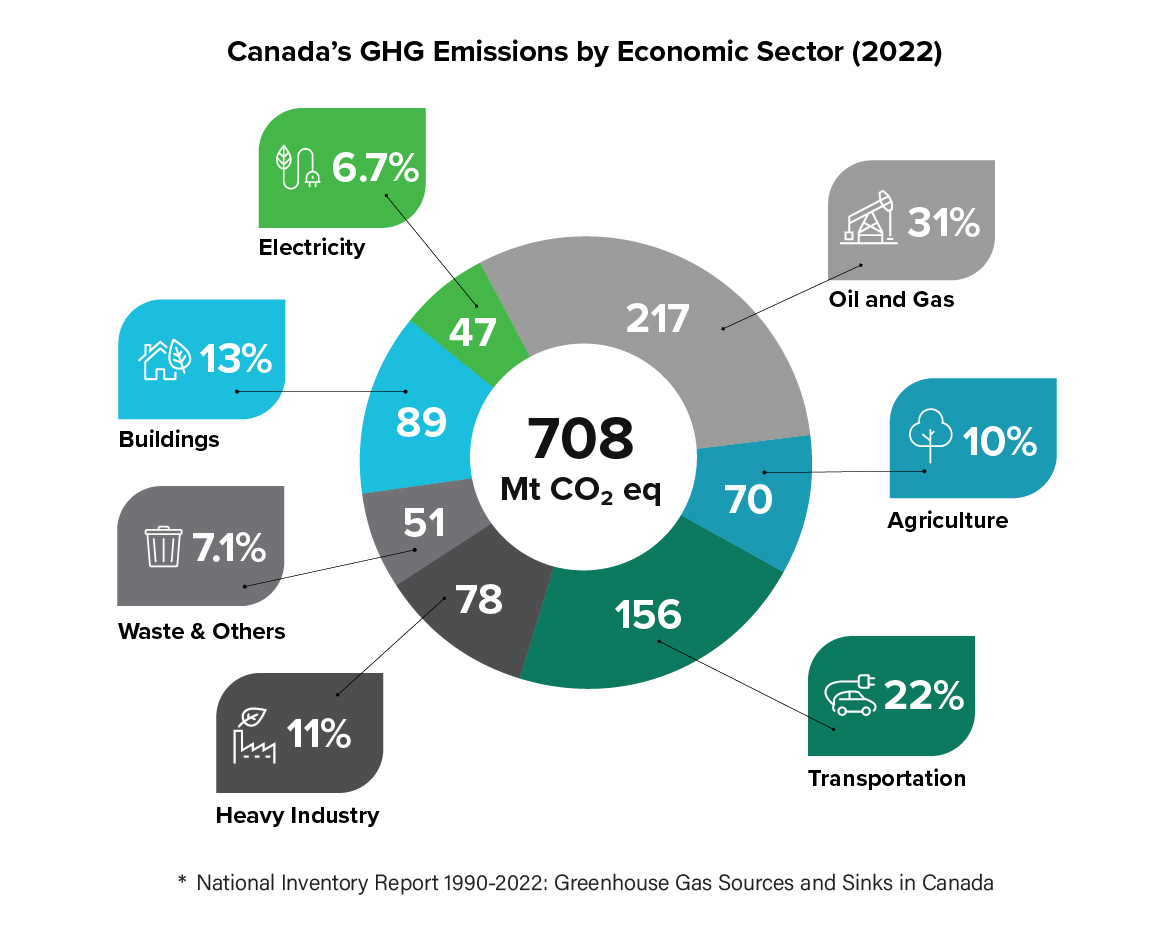
Figure 1: Canada's greenhouse gas emissions by economic sector (2022).
Sector |
Mt CO2 eq |
Percent of total emissions |
|---|---|---|
Electricity |
47 |
6.7% |
Oil and gas |
217 |
31% |
Transport |
156 |
22% |
Buildings |
89 |
13% |
Heavy industry |
78 |
11% |
Agriculture |
70 |
10% |
Waste and others |
51 |
7.1% |
Total |
708 |
- |

Figure 2: Canadian GHG Emission Trend (excluding Land Use, Land-Use Change and Forestry) (1990-2022)
Figure 2 is a line graph displaying actual GHG emissions for 1990 to 2022 (Mt CO2 eq). The figure shows that GHG emissions were increasing slowly over time until 2008, decreased in 2009, then stabilized until 2019, and dropped below 2009 level in 2020. Since 2020, emissions have been increasing slightly again. The following table displays GHG emissions from 1990 to 2022.
Year |
GHG Emissions (Mt CO2 eq) |
|---|---|
1990 |
608 |
1991 |
603 |
1992 |
622 |
1993 |
627 |
1994 |
649 |
1995 |
668 |
1996 |
689 |
1997 |
706 |
1998 |
712 |
1999 |
723 |
2000 |
748 |
2001 |
739 |
2002 |
745 |
2003 |
763 |
2004 |
767 |
2005 |
761 |
2006 |
757 |
2007 |
777 |
2008 |
760 |
2009 |
716 |
2010 |
729 |
2011 |
738 |
2012 |
744 |
2013 |
751 |
2014 |
750 |
2015 |
746 |
2016 |
731 |
2017 |
742 |
2018 |
753 |
2019 |
752 |
2020 |
686 |
2021 |
698 |
2022 |
708 |
Although total emissions are up slightly in 2022, this year's report also shows Canada has continued to keep emissions below 2019 levels, the last year of economic activity before pandemic-related slowdowns. This is noteworthy, with strong economic and population growth in 2021 and 2022.
Progress on climate change is happening, and Canada has been focused and relentless in taking climate action. A series of three climate plans, including the 2030 Emissions Reduction Plan, have corrected the upward trajectory of Canada's emissions. Canada is on a pathway toward achieving the target of 40-45 percent emissions reduction below 2005 levels by 2030.
In December 2023, with the release of the Progress Report on the 2030 Emissions Reduction Plan, the Government of Canada confirmed that Canada's emissions are dropping significantly. On May 2, 2024, Canada published greenhouse gas (GHG) data for 2022 in the 2024 National Inventory Report. Projections modeled on the 2024 National Inventory Report data will be available in December 2024.
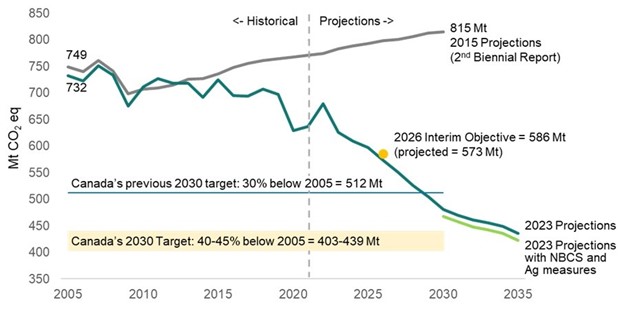
Figure 3: Emissions projections and progress toward the 2030 target.
This graphic is a line graph, displaying Canada's historical emissions and projected emissions trajectory, beginning in 2005 and ending in 2035. The three data lines are: 2015 projections from the Second Biennial Report; 2023 Projections; and 2023 Projections with Nature-Based Climate Solutions (NBCS) and Agriculture Measures. Additionally, the graph indicates Canada's 2026 interim objective (20 percent below 2005 levels), as well as the former (30 percent below 2005 levels) and current (40-45 percent below 2005 levels) 2030 emissions targets.
Year |
2015 Projections (Second Biennial Report) (Mt CO2 eq) |
2023 Projections (Mt CO2 eq) |
2023 Projections with NBCS and Agriculture Measures (Mt CO2 eq) |
|---|---|---|---|
2005 |
749 |
732 |
- |
2006 |
740 |
722 |
- |
2007 |
761 |
751 |
- |
2008 |
741 |
733 |
- |
2009 |
699 |
675 |
- |
2010 |
707 |
712 |
- |
2011 |
709 |
727 |
- |
2012 |
715 |
719 |
- |
2013 |
726 |
718 |
- |
2014 |
727 |
692 |
- |
2015 |
736 |
725 |
- |
2016 |
748 |
695 |
- |
2017 |
755 |
693 |
- |
2018 |
761 |
707 |
- |
2019 |
764 |
697 |
- |
2020 |
768 |
629 |
- |
2021 |
770 |
637 |
- |
2022 |
774 |
679 |
- |
2023 |
783 |
626 |
- |
2024 |
789 |
610 |
- |
2025 |
793 |
597 |
- |
2026 |
798 |
573 |
- |
2027 |
801 |
551 |
- |
2028 |
807 |
526 |
- |
2029 |
812 |
505 |
- |
2030 |
815 |
480 |
467 |
2031 |
- |
470 |
457 |
2032 |
- |
461 |
448 |
2033 |
- |
455 |
442 |
2034 |
- |
448 |
435 |
2035 |
- |
436 |
423 |
Emissions highlights
The emissions data for 2022 confirms Canada's economic growth continues to decouple from its greenhouse gas emissions. Emissions and emissions intensity have diverged consistently since 1990. While Canada's economy continues to grow, Canada's emissions continue to fall. The emissions intensity (greenhouse gases per every dollar of gross domestic product) for the entire Canadian economy has declined by 42 percent since 1990.
This data also provides evidence that many parts of the economy are continuing to become more efficient and greener. The adoption of clean technologies, switching to cleaner fuels and non-emitting electricity (hydro, wind, solar, nuclear), and structural changes in the economy are moving Canada toward net-zero emissions by 2050.
Emissions intensity: The ratio of greenhouse gas emissions per unit of gross domestic product (GDP). Greenhouse gas emissions intensity indicates how closely linked emissions are to economic growth. The decoupling of emissions from economic growth is an essential step to reducing emissions while maintaining economic prosperity.
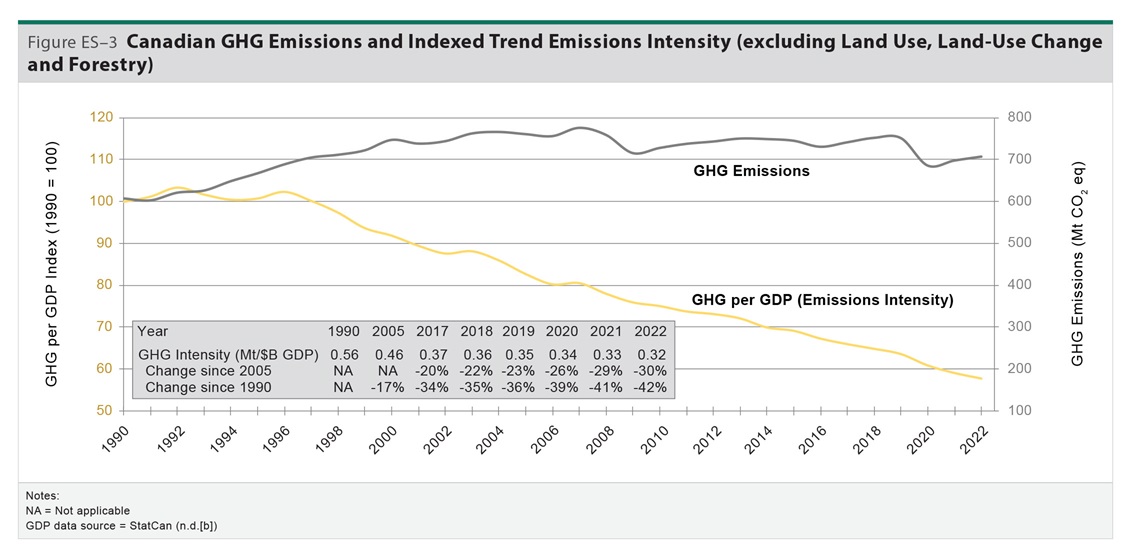
Figure 4: Canadian greenhouse gas emissions and indexed trend emission intensity, excluding land use, land-use change and forestry (LULUCF).
Figure 4 is a line graph displaying actual GHG emissions for 1990 to 2022 (Mt CO2 eq) on one line and indexed trends of GHG emissions per GDP (emissions intensity) on another (Index 1990 = 100). The figure shows that GHG emissions were increasing slowly over time until 2008, decreased in 2009, then stabilized until 2019, and dropped below 2009 level in 2020. Since 2020, emissions have been increasing slightly again. In contrast, the emissions intensity was decreasing constantly during the whole time period from 100 in 1990 to 58 in 2022. On the figure, there is also a table showing the GHG emissions intensity for the years 1990, 2005, and 2017 to 2022, and the changes in percentage since 1990 and 2005. The following table displays GHG emissions and indexed GHG emissions per GDP from 1990 to 2022, and the second table is the one appearing on the graph.
Year |
GHG emissions (Mt) |
Indexed GHG per GDP (emission intensity) |
|---|---|---|
1990 |
608 |
100 |
1991 |
603 |
101 |
1992 |
622 |
103 |
1993 |
627 |
102 |
1994 |
649 |
101 |
1995 |
668 |
101 |
1996 |
689 |
102 |
1997 |
706 |
100 |
1998 |
712 |
97 |
1999 |
723 |
94 |
2000 |
748 |
92 |
2001 |
739 |
89 |
2002 |
745 |
88 |
2003 |
763 |
88 |
2004 |
767 |
86 |
2005 |
761 |
83 |
2006 |
757 |
80 |
2007 |
777 |
81 |
Year |
1990 |
2005 |
2017 |
2018 |
2019 |
2020 |
2021 |
2022 |
|---|---|---|---|---|---|---|---|---|
GHG emissions intensity (Mt/$B GDP) |
0.56 |
0.46 |
0.37 |
0.36 |
0.35 |
0.34 |
0.33 |
0.32 |
Change since 2005 |
NA |
NA |
-20% |
-22% |
-23% |
-26% |
-29% |
-30% |
Change since 1990 |
NA |
-17% |
-34% |
-35% |
-36% |
-39% |
-41% |
-42% |
Although 2022 was a record year of population growth for Canada with over one million new inhabitants, emissions per capita (purple line) have decreased from 24 tonnes in 2005 to 18 tonnes, which is comparable to the United States. Canada's population continues to grow, which requires ongoing action to keep our emissions curve bending downward. The latest National Inventory Report shows greenhouse gas emissions have decreased from 761 megatonnes to 708 megatonnes between 2005 and 2022 (pink dots), and Canada's population (green bars) has increased steadily from 32.4 million in 2005 to 39.3 million 2022Footnote 1.
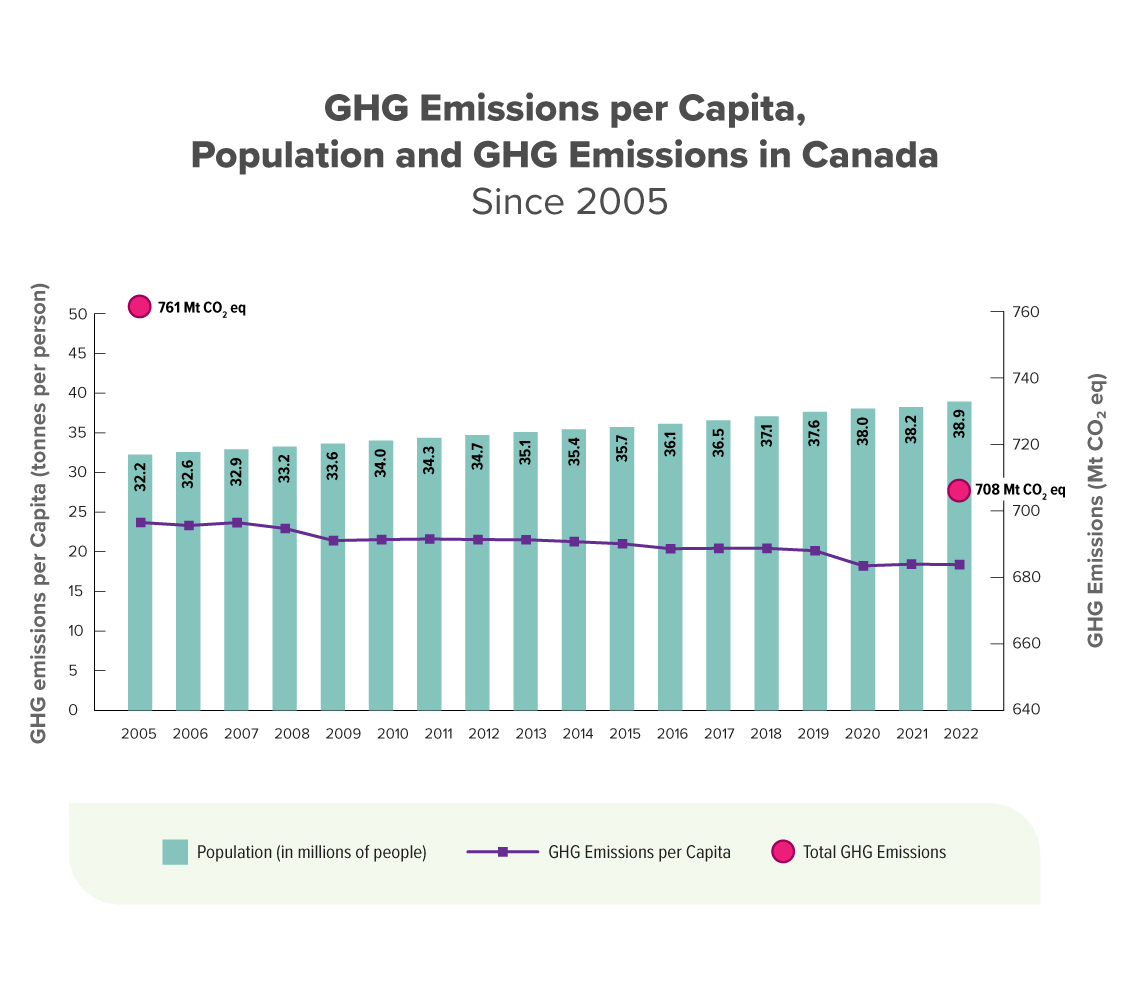
Figure 5: Greenhouse gas per capita, population, and greenhouse gas emissions trends in Canada.
Year |
Population (in millions of people) |
Total emissions in Canada |
Canada GHG per capita |
|---|---|---|---|
2005 |
32.2 |
761 |
23.6 |
2006 |
32.6 |
- |
23.3 |
2007 |
32.9 |
- |
23.6 |
2008 |
33.2 |
- |
22.8 |
2009 |
33.6 |
- |
21.2 |
2010 |
34.0 |
- |
21.4 |
2011 |
34.3 |
- |
21.5 |
2012 |
34.7 |
- |
21.4 |
2013 |
35.1 |
- |
21.4 |
2014 |
35.4 |
- |
21.1 |
2015 |
35.7 |
- |
20.9 |
2016 |
36.1 |
- |
20.3 |
2017 |
36.5 |
- |
20.3 |
2018 |
37.1 |
- |
20.3 |
2019 |
37.6 |
- |
19.9 |
2020 |
38.0 |
- |
18.0 |
2021 |
38.2 |
- |
18.2 |
2022 |
38.9 |
708 |
18.2 |
Since 2005, greenhouse gas emissions have increased in the oil and gas sector (21 megatonnes); the agriculture sector (4.6 megatonnes); and the building sector (3.9 megatonnes). These increases are being offset by decreases in other sectors, notably electricity (-69 megatonnes); heavy industry (-10 megatonnes); and waste and others (-4.3 megatonnes). Since 2005, transport emissions have generally increased, with a significant drop in 2020. In 2022, levels are slightly higher than in 2005.

Figure 6: Change in Canada's economic sector greenhouse gas emissions since 2005.
Change in Canada's economic sector GHG emissions since 2005 |
2005 |
2006 |
2007 |
2008 |
2009 |
2010 |
2011 |
2012 |
2013 |
2014 |
2015 |
2016 |
2017 |
2018 |
2019 |
2020 |
2021 |
2022 |
|---|---|---|---|---|---|---|---|---|---|---|---|---|---|---|---|---|---|---|
Oil and gas |
0 |
7 |
11 |
8 |
3 |
8 |
15 |
24 |
28 |
34 |
34 |
19 |
25 |
33 |
31 |
14 |
20 |
21 |
Electricity |
0 |
-5 |
2 |
-8 |
-23 |
-22 |
-31 |
-34 |
-37 |
-42 |
-42 |
-42 |
-44 |
-54 |
-55 |
-63 |
-65 |
-69 |
Transport |
0 |
1 |
6 |
6 |
5 |
9 |
8 |
8 |
10 |
8 |
6 |
6 |
9 |
13 |
14 |
-13 |
-6 |
0 |
Heavy industry |
0 |
0 |
-2 |
-3 |
-17 |
-13 |
-7 |
-7 |
-8 |
-6 |
-9 |
-11 |
-11 |
-8 |
-9 |
-14 |
-10 |
-10 |
Buildings |
0 |
-5 |
1 |
1 |
-1 |
-3 |
1 |
0 |
1 |
1 |
0 |
1 |
3 |
7 |
9 |
4 |
0 |
4 |
Agriculture |
0 |
-1 |
-1 |
-2 |
-5 |
-5 |
-4 |
-2 |
0 |
-1 |
0 |
1 |
2 |
3 |
4 |
5 |
4 |
5 |
Waste and others |
0 |
-1 |
-2 |
-3 |
-8 |
-6 |
-5 |
-5 |
-4 |
-6 |
-5 |
-4 |
-4 |
-3 |
-3 |
-7 |
-6 |
-4 |
In 2022, the largest contributor to oil and gas emissions was the oil sands category (87 megatonnes, or 40 percent), followed by natural gas production and processing (60 megatonnes); conventional oil production (39 megatonnes); and petroleum refining (17 megatonnes). The primary driver of emissions within the oil and gas sector is production growth. From 1990 to 2022, the production of total crude oil increased by 193 percent. The increase was driven almost entirely by Canada's oil sands operations. Canada's oil sands operations increased by over 800 percent since 1990, accounting for 80 percent of total crude oil production growth.
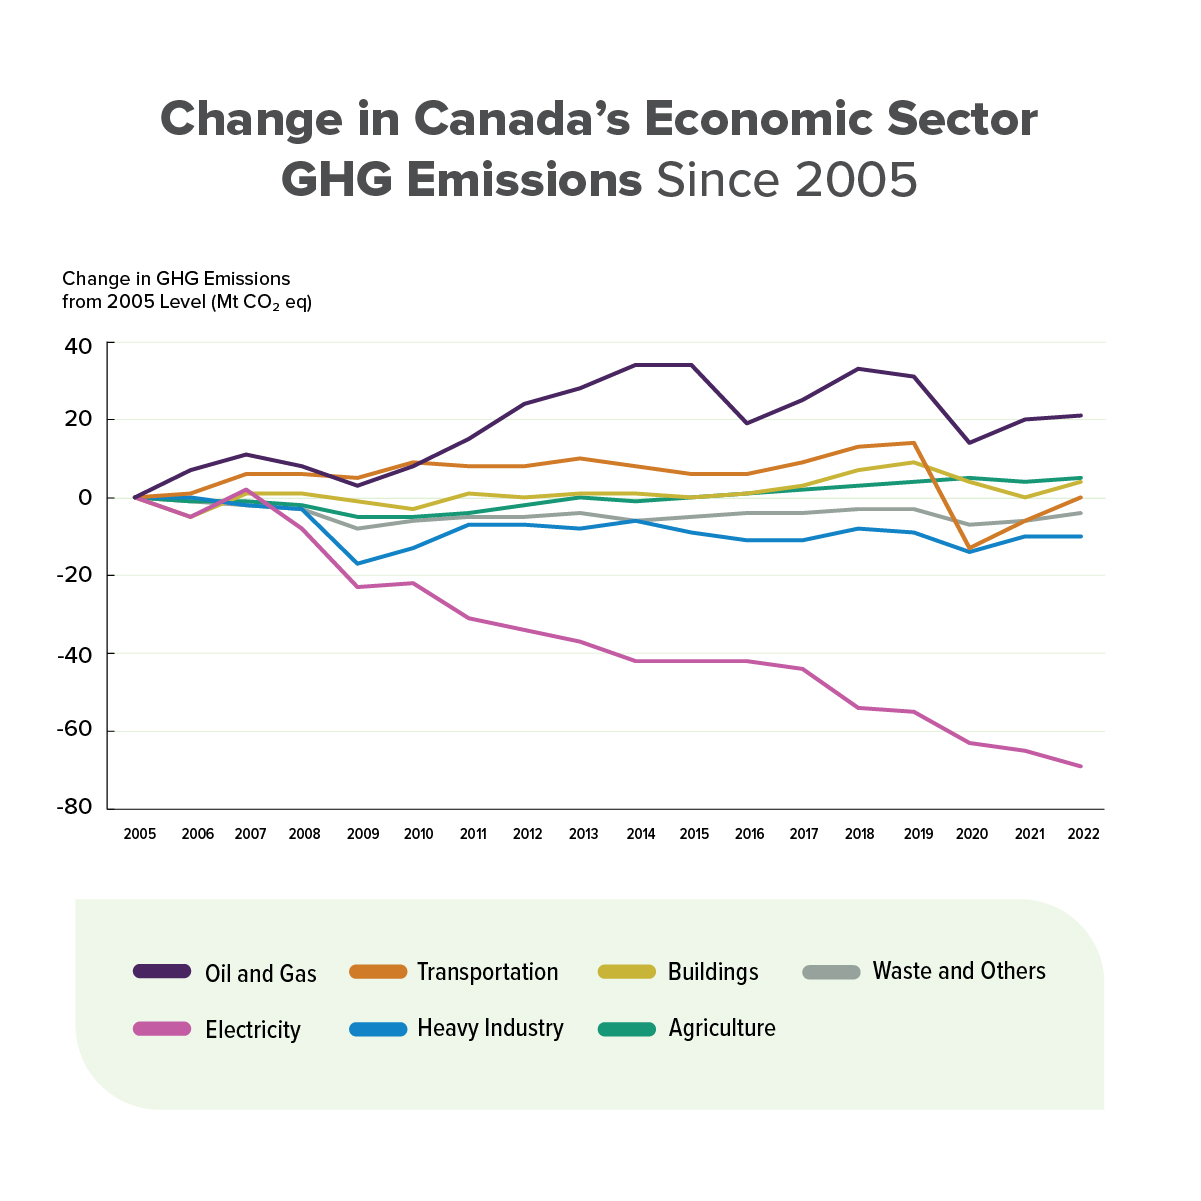
Figure 7: Change in Canada's oil and gas sector greenhouse gas emissions since 2005.
Change in Canada's oil and gas sector GHG since 2005 |
2005 |
2006 |
2007 |
2008 |
2009 |
2010 |
2011 |
2012 |
2013 |
2014 |
2015 |
2016 |
2017 |
2018 |
2019 |
2020 |
2021 |
2022 |
|---|---|---|---|---|---|---|---|---|---|---|---|---|---|---|---|---|---|---|
Natural gas production and processing |
0 |
2 |
3 |
2 |
-3 |
-3 |
0 |
-2 |
-3 |
-4 |
-5 |
-11 |
-12 |
-11 |
-13 |
-15 |
-14 |
-15 |
Conventional oil production |
0 |
0 |
1 |
0 |
-5 |
-3 |
0 |
4 |
6 |
8 |
6 |
0 |
2 |
3 |
1 |
-9 |
-9 |
-9 |
Oil sands (mining, in-situ, upgrading) |
0 |
6 |
9 |
10 |
15 |
20 |
21 |
28 |
31 |
35 |
37 |
34 |
42 |
47 |
48 |
46 |
50 |
51 |
Oil, natural gas and CO2 transmission |
0 |
-1 |
-2 |
-3 |
-4 |
-5 |
-5 |
-5 |
-3 |
-2 |
-2 |
-2 |
-3 |
-2 |
-2 |
-2 |
-1 |
0 |
Petroleum refining |
0 |
0 |
1 |
-1 |
-1 |
0 |
-1 |
-1 |
-1 |
-2 |
-2 |
-2 |
-4 |
-4 |
-3 |
-5 |
-5 |
5 |
Continuing to reduce emissions
The Government of Canada's progress on climate change and lowering emissions continues to ramp up. Some of the national greenhouse gas regulations, investments, and policies will not reach maximum stringency until the later part of this decade. This approach supports Canada's competitiveness by allowing industry and other businesses sufficient time to make investments and take advantage of support programs that will help maintain their competitiveness and continue to provide good-paying jobs for their workers as they transition to cleaner operations.
This work is ongoing: in the 12 months since the last National Inventory Report, the Government of Canada has published the draft Clean Electricity Regulations, strengthened draft Oil and Gas Methane Regulations, and a regulatory framework outlining its approach to Cap Emissions from Oil and Gas. Canada reached a milestone by publishing the Electric Vehicle Availability Standard-the first regulations to be finalized from the 2030 Emissions Reduction Plan.
The work continued in Budget 2024, released on April 16. The Budget includes $903 million toward a Canada Green Buildings Strategy to help drive emissions reductions and energy affordability in Canada's third-largest emitting sector. In launching a new $800 million Canada Greener Homes Affordability program, the government aims to reduce emissions and lower energy bills for renters and homeowners by increasing support for energy-efficient home retrofits. Budget 2024 also invests more than $700 million in clean fuel projects.
Currently, the Government of Canada is in the process of setting Canada's 2035 emissions reduction target. The target will be informed by engagements with provinces, territories, Indigenous peoples, the Net-Zero Advisory Body, and Canadians. More details will be announced by the end of the year.
Notable improvements to calculating Canada's emissions
The 2024 National Inventory Report includes significant improvements to calculating emissions from the upstream oil and gas and managed forest land sectors, along with updated global warming potential values, resulting in better accuracy of Canada's contribution to global warming.
- Oil and gas emissions: Researchers from Ottawa's Carleton University contributed to an enhanced atmospheric measurements quantification methodology for the upstream oil and gas industry. Atmospheric measurements from five key methane sources were integrated into the estimates, resulting in upward revisions ranging from 12 to 20 megatonnes each year between 1990 and 2022. This put Canada at the forefront of including atmospheric measurements in its national inventory.
- Managed forest land sector: New and updated data on historical harvest areas in Canada's forests between 1890 and 1989 were included in the 2024 National Inventory Report. As a result, there were significant revisions to anthropogenic forest carbon sinks and reported carbon removals from managed forests. This impacted both the level of, and the trend in, emissions and removals from the land sector, since the net balance for the forest sector is now a net source of emissions in all years of the time-series. In 2022, emissions from the land-use, land-use change, and forestry sector were a net source of 51 megatonnes.
- Updated global warming potential values: The 2024 inventory includes implementing updated global warming potential values for six of the seven greenhouse gases that all 194 countries that signed the Paris Agreement are required to track and report on (with the exception of carbon dioxide, being the reference unit).
- Conclusion: All the 2024 inventory improvements, including the updated global warming potential values, resulted in upward revisions of +29 megatonnes in 2005 and +28 megatonnes in 2021. The 2021 to 2022 change is +9.3 megatonnes, with the improved greenhouse gas emissions accounting and an expected increase during Canada's economic recovery following the global pandemic. This is less than the +13 megatonnes that was forecasted by experts in the 2023 Emissions Projection Report.
Footnotes
- Footnote 1
-
Statistics Canada, Populations Estimates, Quarterly Table: 17-10-0009-01 (formerly CANSIM 051-0005), consulted on February 21, 2024 Population estimates, quarterly (statcan.gc.ca).
Return to first footnote 1 referrer


