Overseas merchandise trade statistics provide information on imports and exports of merchandise goods between New Zealand and other countries.
Key facts
This release refers to trade in goods only.
In March 2024, compared with March 2023:
- goods exports rose by $240 million (3.8 percent), to $6.5 billion
- goods imports fell by $1.9 billion (25 percent), to $5.9 billion
- the monthly trade balance was a surplus of $588 million.
| Year | Exports | Imports |
| 2004 | 2781736050 | 2732991147 |
| 2005 | 2794324900 | 2983856400 |
| 2006 | 3181233729 | 3112117544 |
| 2007 | 3313750154 | 3256446710 |
| 2008 | 3431313296 | 3474457172 |
| 2009 | 4052640735 | 3614913746 |
| 2010 | 4075618846 | 3468080192 |
| 2011 | 4618681756 | 4035699993 |
| 2012 | 4206797768 | 4020450510 |
| 2013 | 4407814681 | 3675798082 |
| 2014 | 5032540734 | 4128872543 |
| 2015 | 4904798460 | 4243997100 |
| 2016 | 4200429656 | 4011579806 |
| 2017 | 4589494441 | 4327905303 |
| 2018 | 4797104810 | 4947714216 |
| 2019 | 5599409272 | 4774227958 |
| 2020 | 5611448249 | 5088640357 |
| 2021 | 5471532739 | 5654088248 |
| 2022 | 6468309689 | 7061798285 |
| 2023 | 6256910049 | 7859400205 |
| 2024 | 6497202121 | 5909626684 |
Text alternative for Goods exports and imports, March 2024 month compared with March 2023 month
Exports
Goods exports rose by $240 million (3.8 percent) in March 2024 (to $6.5 billion), compared with March 2023.
Fruit leads exports rise
Fruit rose $170 million (74 percent) to $399 million. This was led by kiwifruit, which rose $141 million (125 percent) to $253 million, and fresh apples, which rose $26 million (27 percent) to $124 million.
| Year | Value |
| 2014 | 111445975 |
| 2015 | 103103914 |
| 2016 | 142558115 |
| 2017 | 149509661 |
| 2018 | 150943844 |
| 2019 | 212366550 |
| 2020 | 322042021 |
| 2021 | 289904528 |
| 2022 | 238324845 |
| 2023 | 229670828 |
| 2024 | 399525960 |
Milk powder, butter, and cheese rose $61 million (3.6 percent), to $1.7 billion.
March 2024 |
Change in value |
Change |
Change in |
Change in |
|
Milk powder, butter, and cheese |
1,731 |
61 |
3.6% |
* |
* |
Milk powder |
899 |
91 |
11% |
18% |
-5.4% |
Milk fats (including butter) |
393 |
15 |
3.9% |
-0.4% |
4.3% |
Cheese |
215 |
-60 |
-22% |
-13% |
-11% |
Fresh milk and cream |
99 |
-19 |
-16% |
* |
* |
* Changes in total quantity are omitted due to differences in units of measure. |
|||||
Other dairy-based products including infant formula and casein fell in this period.
March 2024 |
Change |
Change |
Change |
Change in |
|
Infant formula |
173 |
-36 |
-17% |
1.4% |
-18% |
Casein |
143 |
-42 |
-23% |
10% |
-30% |
Infant formula is included in preparations of milk, cereals, flour, and starch, which fell by $43 million (15 percent) to $237 million.
Top monthly export movements by country
The monthly movements in March 2024, compared with March 2023, for our top export partners (in order of total annual goods exports) were:
- China: total exports were down $33 million (1.9 percent).
- The largest rises were logs, wood, and wood articles, up $95 million; fruit, up $81 million; and petroleum and products, up $33 million.
- The largest falls were meat and edible offal, down $118 million; preparations of milk, cereals, flour, and starch, down $86 million; and pharmaceutical products, down $15 million.
- Australia: total exports were down $30 million (3.7 percent).
- The largest rise was precious metals, jewellery, and coins, up $19 million.
- The largest falls were milk powder, butter, and cheese, down $42 million and iron and steel, and articles, down $25 million.
- USA: total exports were up $62 million (8.0 percent).
- The largest rises were precious metals, jewellery, and coins, up $28 million; milk powder, butter, and cheese, up $25 million; and meat and edible offal, up $20 million.
- The largest fall was animal or vegetable fats and oils, down $12 million.
- EU: total exports were up $16 million (3.6 percent).
- The largest rises were fruit, up $65 million and milk powder, butter, and cheese, up $13 million.
- The largest falls were ships, boats, and floating structures, down $36 million and stone, plaster, concrete, and asbestos, down $17 million.
- Japan: total exports were down $52 million (15 percent).
- The largest rise was meat and edible offal, up $18 million.
- The largest fall was fruit, down $29 million.
Imports
Goods imports fell by $1.9 billion (25 percent), in March 2024 (to $5.9 billion), compared with March 2023.
Fall in imports driven by transportation sector
Aircraft and parts fell $401 million (92 percent) to $36 million.
Petroleum and products fell $394 million (31 percent) to $872 million.
March 2024 |
Change |
Change |
Change |
Change in |
|
Petroleum and products |
872 |
394 |
-31% |
* |
* |
Diesel |
420 |
-169 |
-29% |
-17% |
-14% |
Petrol |
249 |
-107 |
-30% |
* |
* |
Jet fuel |
123 |
-111 |
-47% |
-40% |
-13% |
* Changes in total quantity are omitted due to differences in units of measure. |
|||||
Vehicles, parts, and accessories fell $283 million (28 percent) to $713 million. This was led by passenger cars which fell $105 million (18 percent) to $468 million, which was in turn led by electric passenger cars which fell $72 million (66 percent) to $38 million.
| Month | Other | HEV | PHEV | Electric |
| Mar-22 | 432914939 | 63714485 | 6931922 | 41730321 |
| Apr-22 | 353676332 | 68287386 | 16916736 | 35016357 |
| May-22 | 405148618 | 93457479 | 11153107 | 49731680 |
| Jun-22 | 366025746 | 100152956 | 9975408 | 46481624 |
| Jul-22 | 383774126 | 72303074 | 7308475 | 153919586 |
| Aug-22 | 373750044 | 95198279 | 11221022 | 64855409 |
| Sep-22 | 379943584 | 88515774 | 7028620 | 136572474 |
| Oct-22 | 464230324 | 100329020 | 8391663 | 133473999 |
| Nov-22 | 406069353 | 70640731 | 18231939 | 221704319 |
| Dec-22 | 423601962 | 110082044 | 11398075 | 57197939 |
| Jan-23 | 261749065 | 66207262 | 9563264 | 68764372 |
| Feb-23 | 243638207 | 99096843 | 41144095 | 138147182 |
| Mar-23 | 287256819 | 156023891 | 20838768 | 109087662 |
| Apr-23 | 269759761 | 110032213 | 28727919 | 74185027 |
| May-23 | 296391099 | 111196858 | 28938518 | 151780135 |
| Jun-23 | 356949316 | 178093237 | 36187889 | 56724018 |
| Jul-23 | 299509101 | 158775465 | 24720962 | 138306074 |
| Aug-23 | 419049912 | 115442165 | 79162989 | 108099406 |
| Sep-23 | 331503595 | 148692046 | 45003392 | 136808866 |
| Oct-23 | 386357028 | 125506411 | 21807535 | 107236218 |
| Nov-23 | 267529617 | 151796379 | 17265922 | 97521360 |
| Dec-23 | 263697530 | 134919090 | 52762931 | 63073869 |
| Jan-24 | 196213539 | 71810232 | 27564849 | 73119248 |
| Feb-24 | 261370417 | 105146524 | 39029554 | 39842362 |
| Mar-24 | 288504439 | 123443598 | 18266141 | 37510767 |
Top monthly import movements by country
The monthly movements in March 2024, compared with March 2023, for our top import partners (in order of total annual goods imports) were:
- China: total imports were down $289 million (20 percent).
- There were no significant rises over $10 million.
- The largest falls were electrical machinery and equipment, down $92 million; railway stock, down $45 million; and vehicles, parts, and accessories, down $43 million.
- EU: total imports were down $571 million (43 percent).
- There were no significant rises over $10 million.
- The largest falls were art and antiques, down $187 million; aircraft and parts, down $130 million; and vehicles, parts, and accessories, down $90 million.
- Australia: total imports were down $98 million (13 percent).
- The largest rises were inorganic chemicals, up $19 million and food residues, wastes, and fodder, up $11 million.
- The largest falls were precious metals, jewellery, and coins, down $21 million; pharmaceutical products, down $12 million; and iron and steel, and articles, down $11 million.
- USA: total imports were down $361 million (42 percent).
- The largest rises were petroleum and products, up $27 million and food residues, wastes, and fodder, up $18 million.
- The largest falls were aircraft and parts, down $271 million; mechanical machinery and equipment, down $40 million; and vehicles, parts, and accessories, down $40 million.
- South Korea: total imports were down $106 million (21 percent).
- The largest rise was vehicles, parts, and accessories, up $26 million.
- The largest fall was petroleum and products, down $116 million.
Trade surplus in March 2024
The monthly trade balance was a surplus of $588 million.
| Month | Trade balance |
| Mar-15 | 660801360 |
| Apr-15 | 184071873 |
| May-15 | 367170522 |
| Jun-15 | -181952163 |
| Jul-15 | -730443957 |
| Aug-15 | -1090170040 |
| Sep-15 | -1140014218 |
| Oct-15 | -904822585 |
| Nov-15 | -795426228 |
| Dec-15 | -41905853 |
| Jan-16 | 12320231 |
| Feb-16 | 366925311 |
| Mar-16 | 188849850 |
| Apr-16 | 349530073 |
| May-16 | 343078843 |
| Jun-16 | 106790388 |
| Jul-16 | -351427805 |
| Aug-16 | -1239891851 |
| Sep-16 | -1387987389 |
| Oct-16 | -797651150 |
| Nov-16 | -723201112 |
| Dec-16 | -1435171 |
| Jan-17 | -226543047 |
| Feb-17 | -42276469 |
| Mar-17 | 261589138 |
| Apr-17 | 546879922 |
| May-17 | 62020162 |
| Jun-17 | 243117487 |
| Jul-17 | 92027349 |
| Aug-17 | -1174342582 |
| Sep-17 | -1165209854 |
| Oct-17 | -839633458 |
| Nov-17 | -1222417301 |
| Dec-17 | 614310559 |
| Jan-18 | -662421494 |
| Feb-18 | 188256546 |
| Mar-18 | -150609406 |
| Apr-18 | 199745211 |
| May-18 | 199288004 |
| Jun-18 | -285260079 |
| Jul-18 | -203110333 |
| Aug-18 | -1566757996 |
| Sep-18 | -1579921712 |
| Oct-18 | -1305105133 |
| Nov-18 | -1003973060 |
| Dec-18 | 9286883 |
| Jan-19 | -934926531 |
| Feb-19 | -93584137 |
| Mar-19 | 825181314 |
| Apr-19 | 360963002 |
| May-19 | 174927698 |
| Jun-19 | 329812747 |
| Jul-19 | -732335397 |
| Aug-19 | -1641634097 |
| Sep-19 | -1309937148 |
| Oct-19 | -1038380593 |
| Nov-19 | -786493088 |
| Dec-19 | 379772255 |
| Jan-20 | -395635011 |
| Feb-20 | 550639307 |
| Mar-20 | 522807892 |
| Apr-20 | 1374019783 |
| May-20 | 1222702687 |
| Jun-20 | 416538602 |
| Jul-20 | 387761796 |
| Aug-20 | -320606284 |
| Sep-20 | -1132334429 |
| Oct-20 | -465913506 |
| Nov-20 | 679104 |
| Dec-20 | 230069561 |
| Jan-21 | -729765438 |
| Feb-21 | 449847010 |
| Mar-21 | -182555509 |
| Apr-21 | 557914991 |
| May-21 | 404936125 |
| Jun-21 | 442108253 |
| Jul-21 | -387158502 |
| Aug-21 | -2132508281 |
| Sep-21 | -2166033786 |
| Oct-21 | -1282573004 |
| Nov-21 | -1085761728 |
| Dec-21 | -990246456 |
| Jan-22 | -1106744295 |
| Feb-22 | -714801157 |
| Mar-22 | -593488596 |
| Apr-22 | 469495559.5 |
| May-22 | 148263036 |
| Jun-22 | -1132868318 |
| Jul-22 | -1415192071 |
| Aug-22 | -2634137110 |
| Sep-22 | -2519671472 |
| Oct-22 | -2315527621 |
| Nov-22 | -2183787239 |
| Dec-22 | -650530508 |
| Jan-23 | -2095237898 |
| Feb-23 | -846757630 |
| Mar-23 | -1602490156 |
| Apr-23 | 220723935 |
| May-23 | 41615990.2 |
| Jun-23 | -114738381 |
| Jul-23 | -1174149043 |
| Aug-23 | -2266681329 |
| Sep-23 | -2420838856 |
| Oct-23 | -1732504563 |
| Nov-23 | -1258971689 |
| Dec-23 | -372771305 |
| Jan-24 | -1067919856 |
| Feb-24 | -314650721 |
| Mar-24 | 587575437 |
March 2024 quarter
March 2024 values are seasonally adjusted and compared with the December 2023 quarter.
- Goods exports rose 6.1 percent ($1.0 billion) to $17.8 billion, following a 1.5 percent rise in the December 2023 quarter.
- Goods imports fell 1.7 percent ($334 million) to $19.0 billion, following a 3.0 percent fall in the December 2023 quarter.
- The quarterly trade balance was a deficit of $1.2 billion.
March 2024 year
Annual values are actual and compared with the year ended March 2023.
- Annual goods exports were valued at $69.1 billion, down $3.0 billion from the previous year.
- Annual goods imports were valued at $79.0 billion, down $10.0 billion from the previous year.
- The annual trade deficit was $9.9 billion. In the year ended March 2023 the deficit was $16.8 billion.
| Year | Trade balance |
| Mar-14 | 798308321.7 |
| Apr-14 | 1095053945 |
| May-14 | 1319568933 |
| Jun-14 | 1188788452 |
| Jul-14 | 1034361247 |
| Aug-14 | 1805429958 |
| Sep-14 | 667403260.8 |
| Oct-14 | -55529708.2 |
| Nov-14 | -491585024.2 |
| Dec-14 | -1183419240 |
| Jan-15 | -1416085181 |
| Feb-15 | -2129195222 |
| Mar-15 | -2372062053 |
| Apr-15 | -2655363178 |
| May-15 | -2552535649 |
| Jun-15 | -2974536000 |
| Jul-15 | -2762446249 |
| Aug-15 | -3388079713 |
| Sep-15 | -3169130897 |
| Oct-15 | -3182409618 |
| Nov-15 | -3694857477 |
| Dec-15 | -3536562994 |
| Jan-16 | -3576399416 |
| Feb-16 | -3293445747 |
| Mar-16 | -3765397257 |
| Apr-16 | -3599939057 |
| May-16 | -3624030736 |
| Jun-16 | -3335288185 |
| Jul-16 | -2956272033 |
| Aug-16 | -3105993844 |
| Sep-16 | -3353967015 |
| Oct-16 | -3246795580 |
| Nov-16 | -3174570464 |
| Dec-16 | -3134099782 |
| Jan-17 | -3372963060 |
| Feb-17 | -3782164840 |
| Mar-17 | -3709425552 |
| Apr-17 | -3512075703 |
| May-17 | -3793134384 |
| Jun-17 | -3656807285 |
| Jul-17 | -3213352131 |
| Aug-17 | -3147802862 |
| Sep-17 | -2925025327 |
| Oct-17 | -2967007635 |
| Nov-17 | -3466223824 |
| Dec-17 | -2850478094 |
| Jan-18 | -3286356541 |
| Feb-18 | -3055823526 |
| Mar-18 | -3468022070 |
| Apr-18 | -3815156781 |
| May-18 | -3677888939 |
| Jun-18 | -4206266505 |
| Jul-18 | -4501404187 |
| Aug-18 | -4893819601 |
| Sep-18 | -5308531459 |
| Oct-18 | -5774003134 |
| Nov-18 | -5555558893 |
| Dec-18 | -6160582569 |
| Jan-19 | -6433087606 |
| Feb-19 | -6714928289 |
| Mar-19 | -5739137569 |
| Apr-19 | -5577919778 |
| May-19 | -5602280084 |
| Jun-19 | -4987207258 |
| Jul-19 | -5516432322 |
| Aug-19 | -5591308423 |
| Sep-19 | -5321323859 |
| Oct-19 | -5054599319 |
| Nov-19 | -4837119347 |
| Dec-19 | -4466633975 |
| Jan-20 | -3927342455 |
| Feb-20 | -3283119011 |
| Mar-20 | -3585492433 |
| Apr-20 | -2572435652 |
| May-20 | -1524660663 |
| Jun-20 | -1437934808 |
| Jul-20 | -317837615 |
| Aug-20 | 1003190198 |
| Sep-20 | 1180792917 |
| Oct-20 | 1753260004 |
| Nov-20 | 2540432196 |
| Dec-20 | 2390729502 |
| Jan-21 | 2056599075 |
| Feb-21 | 1955806778 |
| Mar-21 | 1250443377 |
| Apr-21 | 434338585 |
| May-21 | -383427977 |
| Jun-21 | -357858326 |
| Jul-21 | -1132778624 |
| Aug-21 | -2944680621 |
| Sep-21 | -3978379978 |
| Oct-21 | -4795039476 |
| Nov-21 | -5881480308 |
| Dec-21 | -7101796325 |
| Jan-22 | -7478775182 |
| Feb-22 | -8643423349 |
| Mar-22 | -9054356436 |
| Apr-22 | -9142775868 |
| May-22 | -9399448957 |
| Jun-22 | -10974425528 |
| Jul-22 | -12002459097 |
| Aug-22 | -12504087926 |
| Sep-22 | -12857725612 |
| Oct-22 | -13890680229 |
| Nov-22 | -14988705740 |
| Dec-22 | -14648989792 |
| Jan-23 | -15637483395 |
| Feb-23 | -15769439868 |
| Mar-23 | -16778441428 |
| Apr-23 | -17027213052 |
| May-23 | -17133860098 |
| Jun-23 | -16115730161 |
| Jul-23 | -15874687133 |
| Aug-23 | -15507231352 |
| Sep-23 | -15408398736 |
| Oct-23 | -14825375678 |
| Nov-23 | -13900560128 |
| Dec-23 | -13622800925 |
| Jan-24 | -12595482883 |
| Feb-24 | -12063375974 |
| Mar-24 | -9873310381 |
| Year | Exports | Imports |
| Mar-14 | 50027958728 | 49229650407 |
| Apr-14 | 50491458212 | 49396404267 |
| May-14 | 50989992815 | 49670423882 |
| Jun-14 | 51161136425 | 49972347973 |
| Jul-14 | 51017556730 | 49983195483 |
| Aug-14 | 51254401927 | 49448971969 |
| Sep-14 | 51053416397 | 50386013136 |
| Oct-14 | 50823329360 | 50878859068 |
| Nov-14 | 50421695797 | 50913280821 |
| Dec-14 | 50074641250 | 51258060490 |
| Jan-15 | 49687287730 | 51103372911 |
| Feb-15 | 49042886225 | 51172081447 |
| Mar-15 | 48915143951 | 51287206004 |
| Apr-15 | 48642733035 | 51298096213 |
| May-15 | 48423057431 | 50975593080 |
| Jun-15 | 48396163181 | 51370699181 |
| Jul-15 | 48880453005 | 51642899254 |
| Aug-15 | 49057455495 | 52445535208 |
| Sep-15 | 49117987199 | 52287118096 |
| Oct-15 | 48918947187 | 52101356805 |
| Nov-15 | 48952719875 | 52647577352 |
| Dec-15 | 48973550776 | 52510113770 |
| Jan-16 | 49187466085 | 52763865501 |
| Feb-16 | 49537612567 | 52831058314 |
| Mar-16 | 48833243763 | 52598641020 |
| Apr-16 | 49026536183 | 52626475240 |
| May-16 | 49230155446 | 52854186182 |
| Jun-16 | 49324864243 | 52660152428 |
| Jul-16 | 49121608220 | 52077880253 |
| Aug-16 | 48793893786 | 51899887630 |
| Sep-16 | 48583604241 | 51937571256 |
| Oct-16 | 48696300602 | 51943096182 |
| Nov-16 | 48493856234 | 51668426698 |
| Dec-16 | 48486904078 | 51621003860 |
| Jan-17 | 48527688853 | 51900651913 |
| Feb-17 | 48305011954 | 52087176794 |
| Mar-17 | 48694076739 | 52403502291 |
| Apr-17 | 49076148830 | 52588224533 |
| May-17 | 49424472301 | 53217606685 |
| Jun-17 | 49873491508 | 53530298793 |
| Jul-17 | 50528773127 | 53742125258 |
| Aug-17 | 50834401328 | 53982204190 |
| Sep-17 | 51160043929 | 54085069256 |
| Oct-17 | 51791672041 | 54758679676 |
| Nov-17 | 52532859588 | 55999083412 |
| Dec-17 | 53625488161 | 56475966255 |
| Jan-18 | 53965184420 | 57251540961 |
| Feb-18 | 54395355682 | 57451179208 |
| Mar-18 | 54602966051 | 58070988121 |
| Apr-18 | 54860205151 | 58675361932 |
| May-18 | 55304076433 | 58981965372 |
| Jun-18 | 55490192916 | 59696459421 |
| Jul-18 | 56206201587 | 60707605774 |
| Aug-18 | 56493336022 | 61387155623 |
| Sep-18 | 56954044261 | 62262575720 |
| Oct-18 | 57226558637 | 63000561771 |
| Nov-18 | 57470599037 | 63026157930 |
| Dec-18 | 57251104265 | 63411686834 |
| Jan-19 | 57320341207 | 63753428813 |
| Feb-19 | 57583937302 | 64298865591 |
| Mar-19 | 58386241764 | 64125379333 |
| Apr-19 | 58900924296 | 64478844074 |
| May-19 | 59293597157 | 64895877241 |
| Jun-19 | 59378412551 | 64365619809 |
| Jul-19 | 58963308257 | 64479740579 |
| Aug-19 | 59050318141 | 64641626564 |
| Sep-19 | 59153331446 | 64474655305 |
| Oct-19 | 59330562863 | 64385162182 |
| Nov-19 | 59689705163 | 64526824510 |
| Dec-19 | 59899236281 | 64365870256 |
| Jan-20 | 60232430772 | 64159773227 |
| Feb-20 | 60412604751 | 63695723762 |
| Mar-20 | 60424643728 | 64010136161 |
| Apr-20 | 60267881085 | 62840316737 |
| May-20 | 59860029862 | 61384690525 |
| Jun-20 | 59923371349 | 61361306157 |
| Jul-20 | 59958852127 | 60276689742 |
| Aug-20 | 60267415950 | 59264225752 |
| Sep-20 | 59811824505 | 58631031588 |
| Oct-20 | 59608519266 | 57855259262 |
| Nov-20 | 59310670094 | 56770237898 |
| Dec-20 | 59352090268 | 56961360766 |
| Jan-21 | 58791158732 | 56734559657 |
| Feb-21 | 58648923039 | 56693116261 |
| Mar-21 | 58509007529 | 57258564152 |
| Apr-21 | 58727983912 | 58293645327 |
| May-21 | 59187764622 | 59571192599 |
| Jun-21 | 60317064345 | 60674922671 |
| Jul-21 | 61137731227 | 62270509851 |
| Aug-21 | 61130377632 | 64075058253 |
| Sep-21 | 61626437404 | 65604817382 |
| Oct-21 | 62203301840 | 66998341316 |
| Nov-21 | 62957144846 | 68838625154 |
| Dec-21 | 63494172023 | 70595968348 |
| Jan-22 | 64179336420 | 71658111602 |
| Feb-22 | 64623309414 | 73266732763 |
| Mar-22 | 65620086364 | 74674442800 |
| Apr-22 | 66238532811 | 75381308679 |
| May-22 | 67249624549 | 76649073506 |
| Jun-22 | 67320451696 | 78294877224 |
| Jul-22 | 67880911372 | 79883370469 |
| Aug-22 | 68799762323 | 81303850249 |
| Sep-22 | 70313919973 | 83171645585 |
| Oct-22 | 70886872314 | 84777552543 |
| Nov-22 | 71544229919 | 86532935659 |
| Dec-22 | 71970611821 | 86619601613 |
| Jan-23 | 72476808672 | 88114292067 |
| Feb-23 | 72353029898 | 88122469766 |
| Mar-23 | 72141630258 | 88920071686 |
| Apr-23 | 72569483052 | 89596696104 |
| May-23 | 72717557731 | 89851417829 |
| Jun-23 | 72672011431 | 88787741592 |
| Jul-23 | 71711512987 | 87586200120 |
| Aug-23 | 71402878992 | 86910110344 |
| Sep-23 | 70258409955 | 85666808691 |
| Oct-23 | 69672337565 | 84497713243 |
| Nov-23 | 69280620301 | 83181180429 |
| Dec-23 | 68620962133 | 82243763058 |
| Jan-24 | 68133034790 | 80728517673 |
| Feb-24 | 68855959654 | 80919335628 |
| Mar-24 | 69096251726 | 78969562107 |
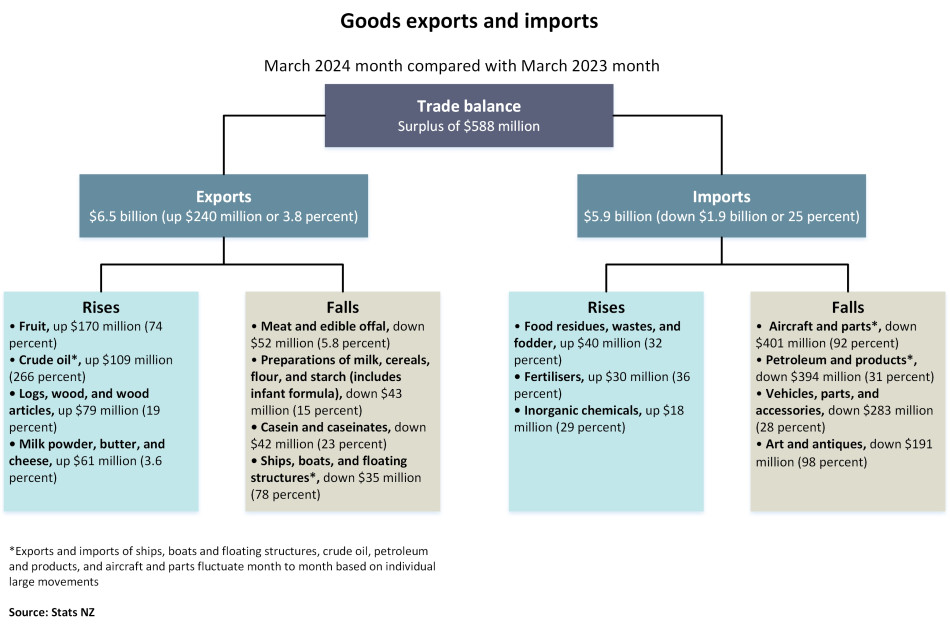
Text alternative for Goods exports and imports, March 2024 month compared with March 2023 month
The diagram shows goods exports and imports for the March 2024 month compared with the March 2023 month.
The trade balance is a surplus of $588 million. This is the difference between exports valued at $6.5 billion (up $240 million or 3.8 percent) and imports valued at $5.9 billion (down $1.9 billion or 25 percent).
Export commodities that rose included: fruit, up $170 million (74 percent); crude oil*, up $109 million (266 percent); logs, wood, and wood articles, up $79 million (19 percent); milk powder, butter, and cheese, up $61 million (3.6 percent).
Export commodities that fell included: meat and edible offal, down $52 million (5.8 percent); preparations of milk, cereals, flour, and starch (includes infant formula), down $43 million (15 percent); casein and caseinates, down $42 million (23 percent); ships, boats, and floating structures*, down $35 million (78 percent).
Import commodities that rose included: food residues, wastes, and fodder, up $40 million (32 percent); fertilisers, up $30 million (36 percent); inorganic chemicals, up $18 million (29 percent).
Import commodities that fell included: aircraft and parts*, down $401 million (92 percent); petroleum and products*, down $394 million (31 percent); vehicles, parts, and accessories, down $283 million (28 percent); art and antiques, down $191 million (98 percent).
*Exports and imports of ships, boats and floating structures, crude oil, petroleum and products, and aircraft and parts fluctuate month to month based on individual large movements
Source: Stats NZ
More data
Use Infoshare to access time-series data for imports and exports.
Subject category: Imports and exports
Overseas merchandise trade datasets has CSV data for goods imports and exports.
International trade: December 2023 quarter has information on trade in goods and services.
Definitions and metadata
Overseas merchandise trade - DataInfo+ provides the definitions of terms used in this release and general methodology used to produce overseas merchandise trade statistics.
Technical enquiries
Petra Lamborn
04 931 4600
[email protected]
ISSN 1178-0320
Next release
Overseas merchandise trade: April 2024 will be released on 24 May 2024.


