E ngā iwi, e ngā reo, e ngā whakahuahuatanga maha, tēnā koutou katoa.
Tēnei te mihi atu ki a koutou i roto i ngā tini āhuatanga o te wā. E mihi ana ki a koutou mō koutou i tahuri mai ki te tautoko i ngā mahi, i tuku hoki i ā koutou mōhiotanga, kōrero ki a mātou. E mōhio ana mātou he taonga nui ngā kōrero o te iwi, o te hapū, o te hapori, me te whānau. Nō reira, ka nui te mihi atu ki a koutou katoa. Tēnei te tāpae atu nei i tēnei kohinga tatauranga ā-tau mō ngā umanga Māori o te motu, e kitea ai ngā tini āhuatanga o ēnei kōkiri nui o te ao Māori. He tini ngā painga, he tini hoki ngā tūmanako mō ēnei mahi a tātou. Nō reira tēnā koutou katoa.
We would like to acknowledge all of those who contributed to this data release by providing data through various surveys and other means. We thank you for your support and for sharing your knowledge and information with us. We understand that the information of iwi, hapū, the community, and whānau are treasured, therefore we greatly appreciate your willingness to share such treasures with us.
Tatauranga umanga Māori - Statistics on Māori businesses: 2023 presents information on two subsets of Māori businesses - Māori authorities and other Māori enterprises (Māori businesses that are economically significant but are not Māori authorities) - that contribute to our country's economy. This release also includes data on Māori tourism businesses that may be either Māori authorities or other Māori enterprises. It does not cover all Māori businesses in Aotearoa New Zealand.
Tatauranga umanga Māori - Statistics on Māori businesses: 2023 (te reo Māori) is also available.
Key facts
In 2023:
- 1,338 Māori authorities and 3,849 other Māori enterprises were identified for this release
- of the total 5,187 businesses, 372 (7.2 percent) were identified as Māori tourism businesses
- 17 percent of Māori geographic units were located in the Auckland region
- Māori authorities employed around 12,300 people while other Māori enterprises employed around 39,200 people
- around 22 percent of Māori authorities operated in primary industries
- the average size of Māori farms was almost 3 times as large as the average New Zealand farm
- Māori authorities exported $816 million worth of goods, 29 percent of this to China
- other Māori enterprises exported $534 million worth of goods
- the total income for Māori authorities was $5.1 billion, down 6.6 percent from the 2022 financial year
- more Māori businesses reported offering support for physical health, mental health, and wellbeing to employees compared with all New Zealand businesses.
Māori authorities are economically significant businesses involved in the collective management of assets held by Māori. Any business within a Māori authority ownership group is also included for the purposes of Tatauranga umanga Māori releases.
'Other Māori enterprises' in this release refers to Māori businesses that are economically significant and are not Māori authorities.
Definitions and metadata has more information on how we identified businesses included in this release.
Māori tourism businesses may be either Māori authorities or other Māori enterprises. They include businesses involved in activities such as accommodation, food, transport, arts and recreation, and administration and support services.
Population changes for 2023 release
The number of other Māori enterprises identified in this release has significantly increased compared with previous releases, due to the addition of new population sources. Therefore, the data here differs from data published in previous Tatauranga umanga Māori releases.
Overview of population changes has more information about these changes.
Topics
Business demography by industry
Employment
Business demography by region
Agriculture
Exports of commodities
Financial performance
Business operations
Definitions and metadata
Overview of population changes
Business demography by industry
Māori authorities
There were 1,338 Māori authority businesses identified as operating in 2023, an increase of 15 (1.1 percent) compared with 2022.
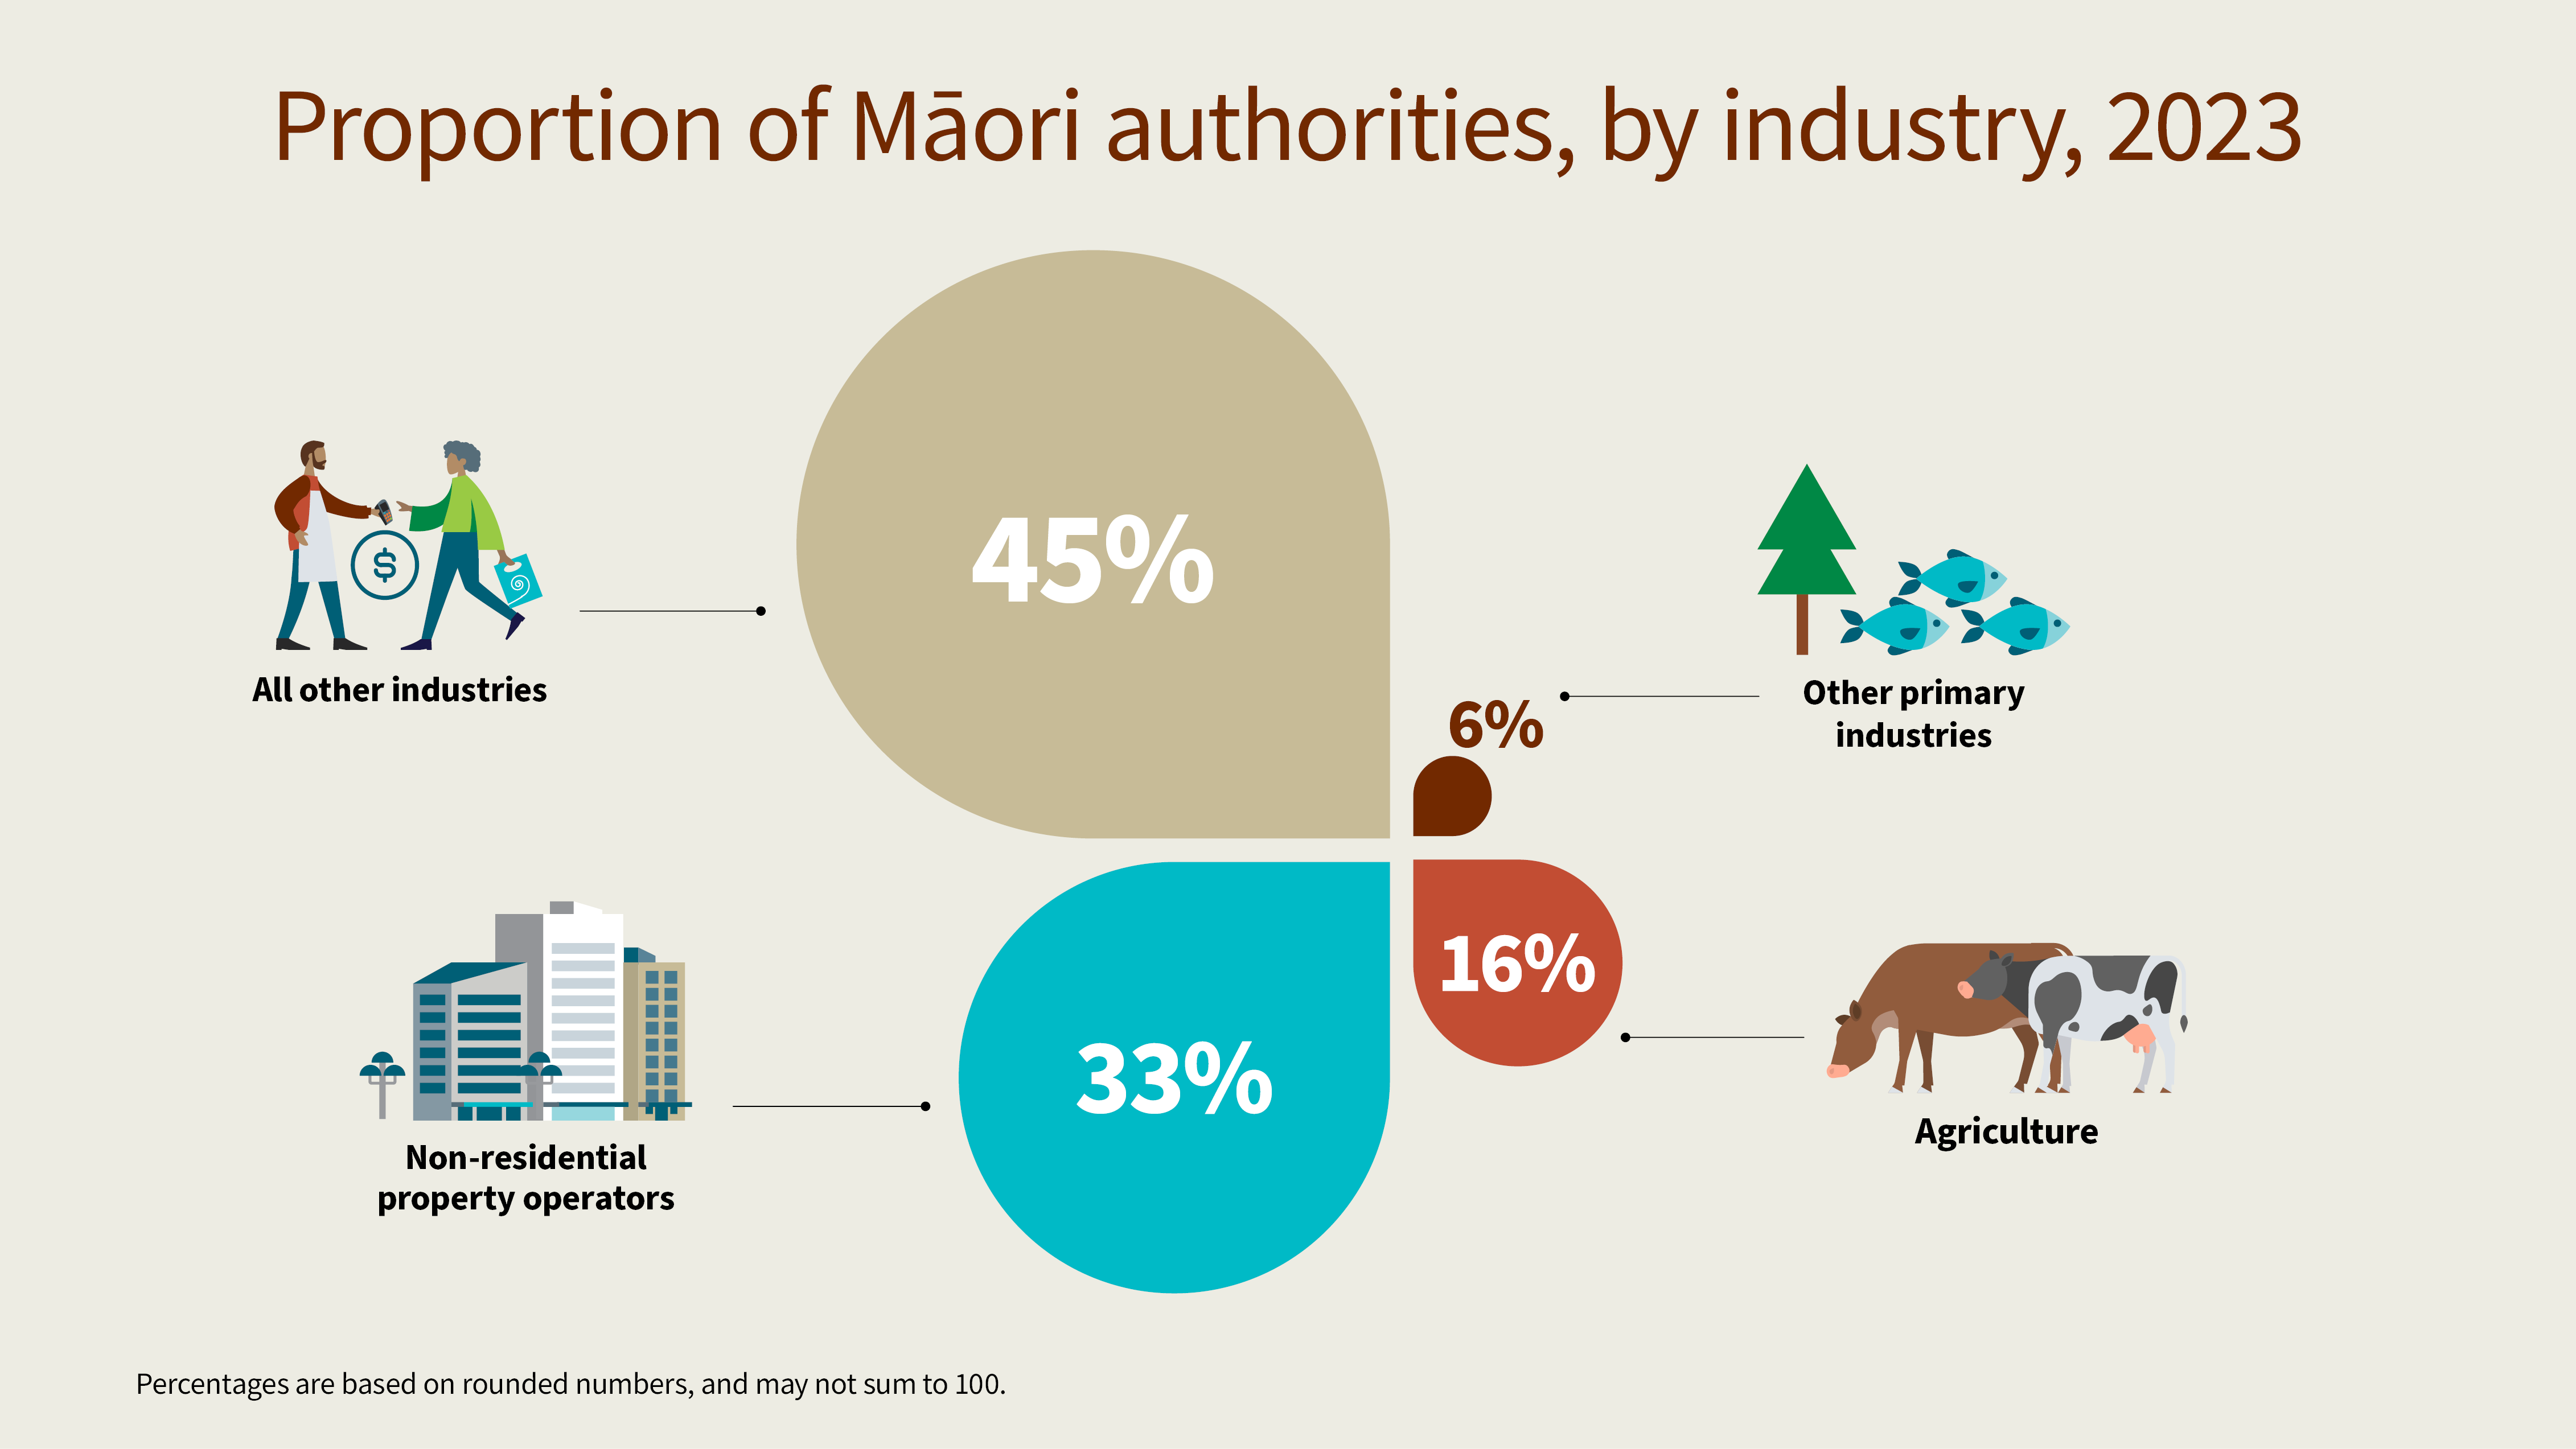
One-fifth (22 percent) of Māori authorities were in the primary industries, and one-third (33 percent) were non-residential property operators, that is, businesses that rent out non-residential properties, such as agricultural land and office space.
Text alternative for Proportion of Māori authorities, by industry, 2023.
Other Māori enterprises
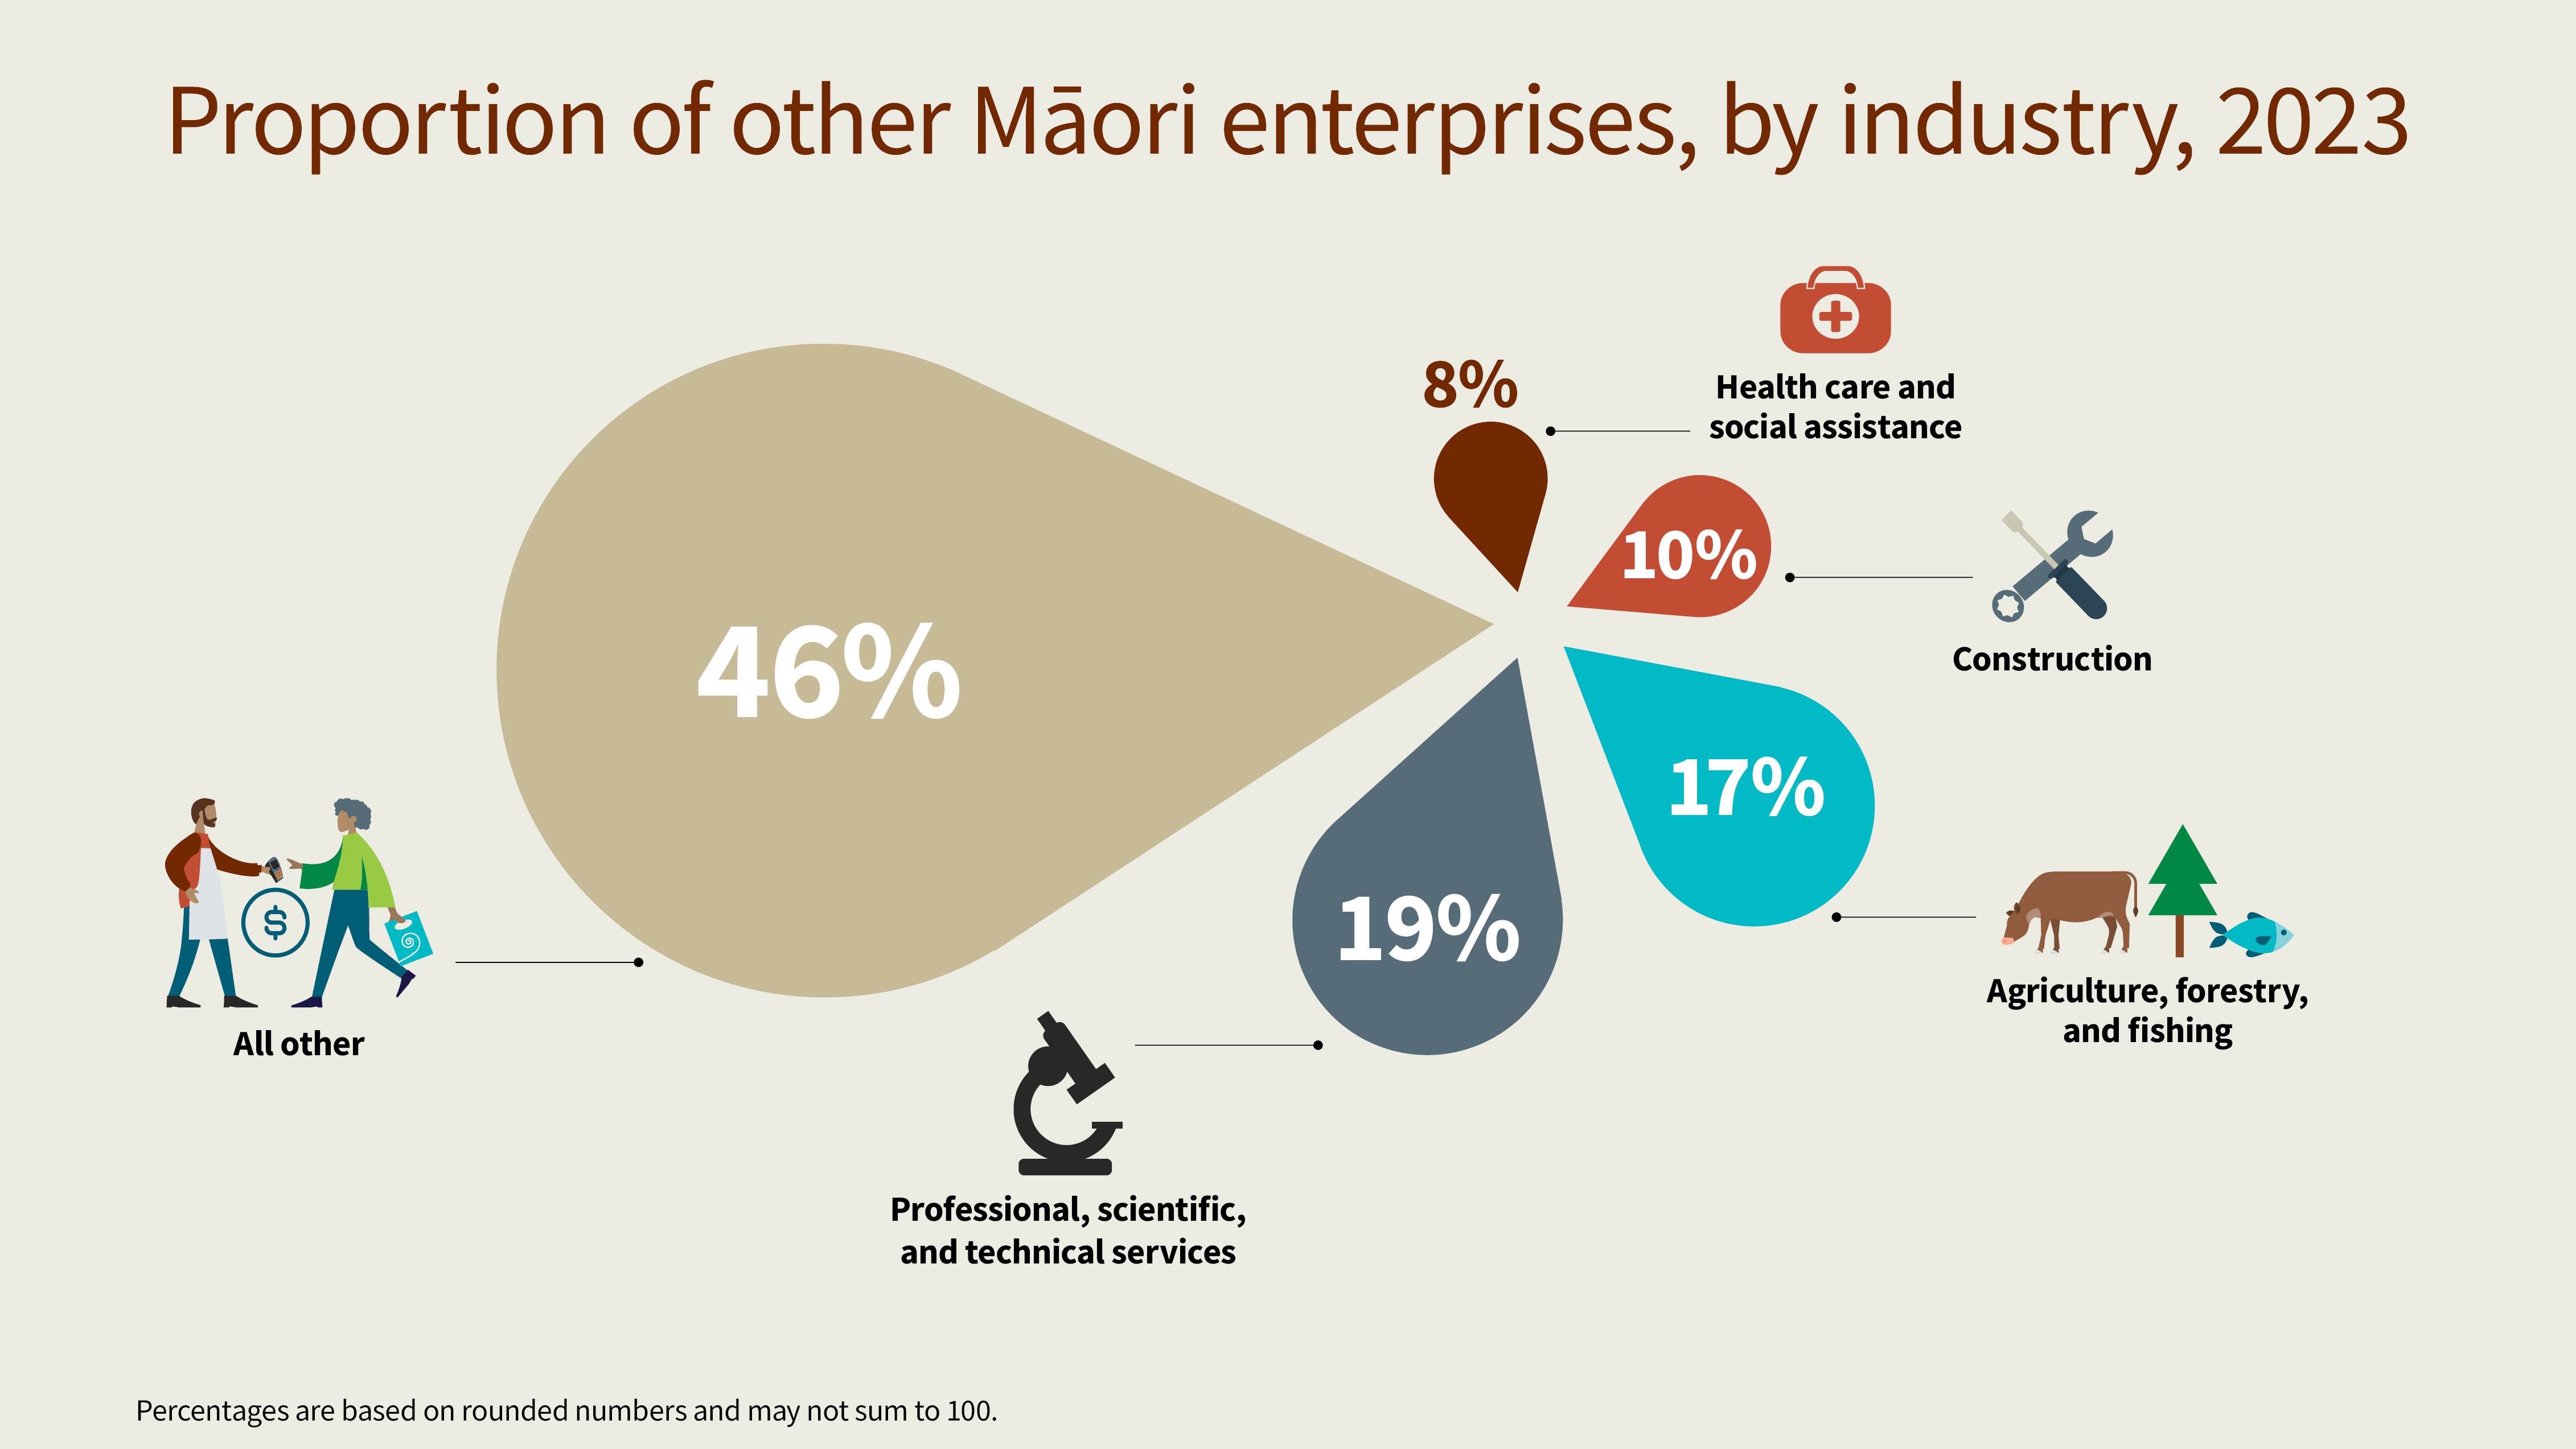
In this release, we report on 3,849 other Māori enterprises, with businesses across a range of industries. The top industries were:
- professional, scientific, and technical services (729 businesses)
- agriculture, forestry, and fishing (669 businesses)
- construction (387 businesses)
- health care and social assistance (300 businesses).
Text alternative for Proportion of other Māori enterprises, by industry, 2023.
Māori tourism businesses
This release includes 372 Māori tourism businesses across the following range of tourism-specific industries:
- arts and recreation services - 168 businesses (45 percent)
- accommodation and food services - 114 businesses (31 percent)
- transport, postal and warehousing - 33 businesses (8.9 percent)
- administrative and support services - 27 businesses (7.3 percent)
- all other industries - 30 businesses (8.1 percent).
Employment
Employee count for Māori authorities
The number of people employed by Māori authorities rose by 400 (3.4 percent) between 2022 and 2023, to 12,300.
The industry with the highest number of employees was agriculture, followed by other primary industries:
- 20 percent of all employees of Māori authorities were employed in agriculture
- 11 percent were employed in other primary industries.
| Period | Agriculture | Other primary industries | Non-residential property operators | All other industries |
| 2017 | 1600 | 1150 | 350 | 7900 |
| 2018 | 1650 | 1100 | 340 | 8200 |
| 2019 | 1850 | 1350 | 370 | 8500 |
| 2020 | 1900 | 1350 | 390 | 8900 |
| 2021 | 1850 | 1250 | 480 | 7100 |
| 2022 | 1900 | 1350 | 460 | 8200 |
| 2023 | 2450 | 1350 | 530 | 7900 |
Employee count for other Māori enterprises
The number of people employed by other Māori enterprises was 39,200 in 2023, down 200 employees (0.5 percent) from 2022.
| Period | Count of employees |
| 2017 | 25100 |
| 2018 | 27800 |
| 2019 | 29700 |
| 2020 | 32000 |
| 2021 | 34400 |
| 2022 | 39400 |
| 2023 | 39200 |
In 2023 compared with 2022, the number of employees in other Māori enterprises changed as follows:
- health care and social assistance industry, down 11 percent (1,100 employees)
- administrative and support services industry, down 5.2 percent (300 employees)
- arts and recreation services industry, up 62 percent (280 employees).
Employee count for Māori tourism businesses
The total number of people employed by Māori tourism businesses in 2023 was 3,450, up 700 employees (25 percent). Following falls in 2021 and 2022, the employee count for Māori tourism businesses in 2023 returned to similar levels seen in 2020 (3,500 employees).
| Year | Count of employees |
| 2017 | 3100 |
| 2018 | 3100 |
| 2019 | 3200 |
| 2020 | 3500 |
| 2021 | 2800 |
| 2022 | 2750 |
| 2023 | 3450 |
| Year | Count of businesses |
| 2017 | 309 |
| 2018 | 318 |
| 2019 | 330 |
| 2020 | 339 |
| 2021 | 348 |
| 2022 | 366 |
| 2023 | 372 |
Employee numbers increased in almost all Māori tourism industries. The biggest movements by industry in 2023 compared with 2022 were:
- arts and recreation services, up 46 percent (330 employees)
- accommodation and food services, up 19 percent (300 employees)
- administrative and support services, up 155 percent (85 employees).
Business demography by region
Counts presented in this section are at the geographic unit level. A geographic unit is a business location engaged in one, or mainly one, kind of economic activity at a single physical site or base (for example, a factory, a farm, a shop, a school, or an office). Therefore, the total number of geographic units and employees reported in this section will differ from the business and employee counts in the sections above.
Count of Māori geographic units by region
In 2023, there were 5,880 Māori geographic units across Aotearoa New Zealand.
Most Māori geographic units (4,914 units, 84 percent) were in the North Island. Of total Māori geographic units, the regions with the most units were:
- Auckland, 984 geographic units (17 percent)
- Bay of Plenty, 975 geographic units (17 percent)
- Waikato, 768 geographic units (13 percent)
- Wellington, 543 geographic units (9.2 percent).
In the South Island, there were 939 Māori geographic units. Areas outside the North and South islands, or 'Area outside region', had 18 Māori geographic units.
Count of employees of Māori geographic units by region
In 2023, Māori geographic units had 51,800 employees across Aotearoa New Zealand. The regions with the highest number of these employees were:
- Auckland, 12,900 employees (25 percent)
- Bay of Plenty, 6,800 employees (13 percent)
- Waikato, 5,800 employees (11 percent)
- Wellington, 5,200 employees (10 percent).
In the South Island, there were 9,400 employees. Areas outside the North and South islands (Area outside region) had 90 employees.
New Zealand business demography statistics: At February 2023 has information on business and employee counts for all New Zealand businesses.
Business demography statistics - DataInfo+ has more information about this data, including general methodology about the collection, definitions for terms used, and data accuracy.
LEED data for Māori authorities
Linked employer-employee data (LEED) includes measures on filled jobs and worker turnover rates. A quarterly measure is used to calculate worker turnover rates, so this section contains quarterly references rather than annual comparisons.
Filled jobs is defined as the number of jobs on the 15th day of the middle month of the reference quarter. There is no distinction between full or part-time jobs. Due to the difference in reference periods and methodology, the number of filled jobs may be different from the number of employees presented in the business demography section.
In the March 2023 quarter, Māori authorities accounted for a total of 11,580 filled jobs. Filled jobs for Māori authorities fell 1.1 percent (130 filled jobs) from the December 2022 quarter. Compared with the March 2022 quarter, filled jobs for Māori authorities rose 3.7 percent (410 filled jobs).
Worker turnover rate is a measure of workforce stability, with a lower rate meaning more stability. It is a ratio of the average number of employees who have joined and who have left employers since the previous reference date compared with the average total number of jobs over the two periods.
Worker turnover rate for Māori authorities in the March 2023 quarter was 16.2 percent, up 1 percentage point from the December 2022 quarter. Compared with the March 2022 quarter, the worker turnover rate for Māori authorities fell 0.5 percentage points.
| Quarter | Māori authorities | Other Māori enterprises | All New Zealand businesses |
| Mar-17 | 19 | 18.3 | 16.6 |
| Jun-17 | 16.9 | 20 | 17.1 |
| Sep-17 | 15.4 | 17.9 | 14.6 |
| Dec-17 | 16.6 | 18.3 | 14.7 |
| Mar-18 | 21.4 | 21 | 20.5 |
| Jun-18 | 21.2 | 20 | 18.6 |
| Sep-18 | 19 | 18.2 | 15.3 |
| Dec-18 | 16 | 18.7 | 15 |
| Mar-19 | 19.1 | 19.6 | 16.8 |
| Jun-19 | 16.3 | 20.3 | 16.3 |
| Sep-19 | 15.3 | 19 | 14.8 |
| Dec-19 | 17.3 | 18.9 | 14.7 |
| Mar-20 | 15.3 | 19.6 | 16.3 |
| Jun-20 | 13.4 | 16.7 | 13.4 |
| Sep-20 | 15 | 17.5 | 12.6 |
| Dec-20 | 15.9 | 17.8 | 13.1 |
| Mar-21 | 15.3 | 18.9 | 14.4 |
| Jun-21 | 16 | 19.7 | 17.6 |
| Sep-21 | 17 | 19.9 | 14.6 |
| Dec-21 | 17 | 17.9 | 13.7 |
| Mar-22 | 16.7 | 20.1 | 15.4 |
| Jun-22 | 15.5 | 19.3 | 16.8 |
| Sep-22 | 15.3 | 18.4 | 14.6 |
| Dec-22 | 15.2 | 18.3 | 14.7 |
| Mar-23 | 16.2 | 17.7 | 15.1 |
LEED data for other Māori enterprises
In the March 2023 quarter, other Māori enterprises accounted for a total of 35,850 filled jobs. Filled jobs for other Māori enterprises fell 3.7 percent (1,370 filled jobs) from the December 2022 quarter. Compared with the March 2022 quarter, filled jobs for other Māori enterprises rose 0.5 percent (170 filled jobs).
Worker turnover rate for other Māori enterprises in the March 2023 quarter was 17.7 percent, down 0.6 percentage points from the December 2022 quarter. Compared with the March 2022 quarter, the worker turnover rate for other Māori enterprises fell 2.4 percentage points.
LEED quarterly technical notes has more detail about measuring worker turnover.
Linked employer-employee data: March 2023 quarter - NZ.Stat tables has information on filled jobs and worker turnover rates for all New Zealand businesses.
Guide to interpreting the LEED Data has more information on worker turnover rates.
Agriculture
For statistical purposes, a farm denotes one or more blocks of land managed as a single operation and engaged in agricultural activity. Māori farms are geographical units belonging to Māori authorities or other Māori enterprises. Activities include livestock farming, horticulture, viticulture, nurseries, forestry, growing grain, and seed crops.
Māori farms size
In 2023, the average size of a Māori farm was 795 hectares, almost three times as large as the average New Zealand farm (285 hectares). This allowed Māori farms to hold higher numbers of livestock comparatively. On average, Māori farms had almost twice as much stock compared with the amount of stock on the average New Zealand farm (3,433 compared with 1,723).
For all farms holding the following types of stock, Māori farms compared with all New Zealand farms had on average:
- 2.7 times as many beef cattle
- 2.6 times as many sheep
- 1.5 times as many dairy cattle.
| Livestock type | Māori farms | All New Zealand farms |
| Total sheep | 4154 | 1604 |
| Breeding ewes and hoggets | 3425 | 1273 |
| Total deer | 787 | 610 |
| Total dairy cattle | 742 | 484 |
| Milking cows and heifers | 631 | 441 |
| Total beef cattle | 453 | 168 |
| Beef breeding cows and heifers | 273 | 112 |
Agricultural production statistics: Year to June 2023 (final) has data about agricultural businesses across Aotearoa New Zealand.
Agricultural production statistics: June 2023 (final) - DataInfo+ has information about agricultural production statistics, including general methodology about the collection, and data accuracy.
Exports of commodities
Exports of goods by Māori authorities
Exports of commodities reported in this release include those directly exported by Māori authorities and other Māori enterprises. Māori enterprises may on-sell their goods to other enterprises who export on their behalf.
Māori authorities exported $816 million worth of goods in 2023, a fall of 6.0 percent compared with 2022. Exports to China made up 29 percent of Māori authority exports, down from 33 percent in the previous year. Exports to countries other than China and the United States of America made up 66 percent of Māori authority exports, up from 62 percent in 2022. This likely indicates Māori authorities are continuing to diversify their export markets.
| Period | People's Republic of China | United States of America | Other |
| 2017 | 299000000 | 42000000 | 290000000 |
| 2018 | 347000000 | 42000000 | 331000000 |
| 2019 | 330000000 | 46000000 | 402000000 |
| 2020 | 273000000 | 41000000 | 474000000 |
| 2021 | 344000000 | 43000000 | 561000000 |
| 2022 | 284000000 | 49000000 | 535000000 |
| 2023 | 239000000 | 37000000 | 540000000 |
Kaimoana accounted for two-fifths (39 percent) of all exports by Māori authorities in 2023, while milk powder, butter, and cheese accounted for 30 percent.
| Period | Kaimoana | "Milk powder | All other |
| 2017 | 313000000 | butter | 150000000 |
| 2018 | 322000000 | and cheese" | 206000000 |
| 2019 | 370000000 | 168000000 | 229000000 |
| 2020 | 316000000 | 193000000 | 315000000 |
| 2021 | 327000000 | 179000000 | 410000000 |
| 2022 | 325000000 | 156000000 | 304000000 |
| 2023 | 317000000 | 210000000 | 255000000 |
Exports of goods by other Māori enterprises
Other Māori enterprises exported a total of $534 million in 2023, a rise of 17 percent from 2022. Of all exports by other Māori enterprises:
- $42 million (8 percent) were to the United States of America
- $40 million (7 percent) were to Australia.
| Selected country | Australia | United States of America | Japan | EU27 (including Destination Unknown - EU) | Pacific Islands Forum (excluding Australia) | Other |
| 2017 | 7000000 | 7000000 | 3000000 | 3000000 | 1000000 | 255000000 |
| 2018 | 12000000 | 10000000 | 3000000 | 3000000 | 2000000 | 275000000 |
| 2019 | 13000000 | 14000000 | 2000000 | 11000000 | 2000000 | 268000000 |
| 2020 | 14000000 | 24000000 | 4000000 | 12000000 | 2000000 | 299000000 |
| 2021 | 21000000 | 31000000 | 2000000 | 10000000 | 2000000 | 347000000 |
| 2022 | 30000000 | 22000000 | 5000000 | 6000000 | 2000000 | 392000000 |
| 2023 | 40000000 | 42000000 | 8000000 | 8000000 | 3000000 | 433000000 |
Overseas merchandise trade: December 2023 provides information on imports and exports of merchandise goods for all New Zealand businesses.
Financial performance
In the 2023 financial year, the total income reported by Māori authorities was $5.1 billion, down 6.6 percent ($364 million) from the previous year. Operating income grew by 1.1 percent ($52 million), while non-operating income fell by 46 percent ($416 million). Total assets were $29.6 billion, up 4.2 percent ($1.2 billion).
Results from the 2023 Annual Enterprise Survey (AES) indicated that total income for all New Zealand businesses increased by 9.6 percent, AES total expenditure rose 13 percent, and AES total assets increased by 3.0 percent.
In 2023 compared with 2022, Māori authority businesses' total surplus before income tax fell more than half, down $763 million (53 percent) to $689 million. This decrease was driven by the fall in non-operating income and an increase in expenses. For the 2021 and 2022 years, non-operating income had been at high levels. Revaluations of assets, such as non-residential property, are often a key contributor to non-operating income.
Operating surplus before tax (excludes non-operating income and non-operating expenses) fell by 30 percent ($218 million) in the 2023 financial year.
| Year | Non-operating surplus before tax | Operating surplus before tax |
| 2017 | 447187000 | 498120000 |
| 2018 | 238561000 | 591332000 |
| 2019 | 200060000 | 579623000 |
| 2020 | 51230000 | 431463000 |
| 2021 | 608227000 | 686100000 |
| 2022 | 738219000 | 713847000 |
| 2023 | 192456000 | 496242000 |
Debt-to-equity-ratio (defined as total liabilities divided by total shareholder equity) of Māori authorities was 37.9 percent in 2023, compared with 34.8 percent in 2022. For all New Zealand businesses in 2023, the debt-to-equity ratio was 196 percent. Māori authorities typically have a lower debt-to-equity ratio compared with non-Māori businesses. This is because Māori authorities tend to rely more on shareholder equity to fund business growth compared with non-Māori businesses, which rely more on creditors and loans.
Annual enterprise survey: 2023 financial year (provisional) has more information on financial performance for all New Zealand businesses.
Business operations
The Business Operations Survey collects information about business practices for the latest financial year that businesses had data available when completing the questionnaire. The survey includes different modules or topics that may change each year. Each module has its own specific objectives. The survey covers businesses with six or more employees.
The 2023 survey included the following modules:
- Module A: Business operations
- Module B: Innovation
- Module C: Business practices
- Module D: Climate change.
More than 80 percent of Māori businesses offer flexible working hours
Flexible working hours was the most common arrangement Māori businesses offered their employees in 2023, with 85 percent of Māori authorities and 83 percent of other Māori enterprises reporting offering this option. This was similar to the proportion of all New Zealand businesses (81 percent) that offered flexible working hours. Other flexible working conditions commonly offered by Māori businesses included options for:
- part-time work, 80 percent of Māori authorities and 77 percent of other Māori enterprises
- work from home, 64 percent of Māori authorities and 53 percent of other Māori enterprises.
Compared with all New Zealand businesses, more Māori businesses reported offering support for physical or mental health and wellbeing to employees. By business type:
- 63 percent of Māori authorities and 69 percent of other Māori enterprises offered support for physical health and wellbeing, compared with 48 percent of all New Zealand businesses
- 82 percent of Māori authorities and 77 percent of other Māori enterprises offered support for mental health and wellbeing, compared with 53 percent of all New Zealand businesses.
| Type of support | Māori authorities | Other Māori enterprises | All New Zealand businesses |
| Flexible working hours | 85 | 83 | 81 |
| Option of part-time work | 80 | 77 | 77 |
| Option to work from home | 64 | 53 | 43 |
| Support for physical health and wellbeing | 63 | 69 | 48 |
| Support for mental health and wellbeing | 82 | 77 | 53 |
'Cost to develop or introduce' is biggest barrier to innovation
Innovation is the development or introduction of any new or significantly improved activity for a business.
In 2023, two-thirds of Māori authorities (66 percent) and other Māori enterprises (67 percent) carried out innovation activities. One-quarter of all business types reported cost to develop or introduce innovations as the biggest barrier to innovation. By business type this was reported by:
- 27 percent of Māori authorities
- 24 percent of other Māori enterprises
- 23 percent of all New Zealand businesses.
The second biggest barrier to innovation was the lack of management resources, with 18 percent of Māori authorities, 17 percent of other Māori enterprises, and 18 percent of all New Zealand businesses reporting this affected innovations to a high degree.
| Barrier | Māori authorities | Other Māori enterprises | All New Zealand businesses |
| Cost to develop or introduce | 27 | 24 | 23 |
| Lack of management resources | 18 | 17 | 18 |
| Lack of appropriate personnel | 17 | 13 | 11 |
| Lack of information | 14 | 5 | 5 |
| Lack of marketing expertise | 11 | 5 | 6 |
| Government regulation | 8 | 11 | 9 |
| Access to intellectual property rights | 5 | 1 | 3 |
| Lack of cooperation with other businesses | 4 | 2 | 4 |
More than half of Māori businesses take measures to reduce their environmental impact
Compared with all New Zealand businesses, more Māori businesses said they had measures in place to reduce their environmental impact in 2023.
Around 7 in 10 Māori authorities (71 percent) reported having measures in place to reduce their environmental impact, compared with 50 percent of other Māori enterprises and 46 percent of all New Zealand businesses.
Business operations survey: 2023 has more information on business practices for all New Zealand businesses.
Definitions and metadata
Data standard for Māori business provides a definition for collecting and producing data and statistics about Māori businesses. Māori businesses are those that are fully or partly owned by a person or people who have Māori whakapapa, and a representative of that business identifies the business as Māori.
Definitions of a Māori business for tatauranga umanga Māori - DataInfo+ explains how we identified the enterprises included in this release.
Methodology for Tatauranga umanga Māori - DataInfo+ explains the methodology for each component of this release and provides more information on the data and tables.
Tatauranga umanga Māori: 2023 pūrongo matatini - Statistics on Māori businesses: 2023 technical report provides contextual and technical information about the publication of Tatauranga umanga Māori.
Overview of population changes
Changes to the population of Māori businesses in this release, compared with previous releases, have been driven by new population data sources and have mostly impacted other Māori enterprises.
The table below provides an overview of changes to business and employee counts for other Māori enterprises for 2021 and 2022.
Counts of businesses - Other Māori enterprises |
|||
Year |
New |
Previously published(1) |
Difference |
2021 |
3,492 |
2,442 |
1,050 |
2022 |
3,795 |
2,628 |
1,167 |
Counts of employees - Other Māori enterprises |
|||
Year |
New |
Previously published(1) |
Difference |
2021 |
34,400 |
27,200 |
7,200 |
2022 |
39,400 |
29,800 |
9,600 |
| 1. Tatauranga umanga Māori - Statistics on Māori businesses: 2022 | |||
Text alternative for Proportion of Māori authorities, by industry, 2023
Infographic shows the percentage of Māori authority businesses by industry for 2023. Sixteen percent of businesses were in agriculture, 6 percent in other primary industries, 33 percent in non-residential property operators, and 45 percent in all other industries. Percentages are based on rounded numbers and may not sum to 100.
Text alternative for Proportion of other Māori enterprises, by industry, 2023
Infographic shows the percentage of other Māori enterprises by industry for 2023. Nineteen percent of businesses were in professional, scientific, and technical services, 17 percent in agriculture, forestry, and fishing, 10 percent in construction, 8 percent in health care and social assistance services, and 46 percent in all other industries. Percentages are based on rounded numbers and may not sum to 100.
Technical enquiries
Niko Slade
04 931 4600
[email protected]
ISSN 2744-6417
Next release
Tatauranga umanga Māori - Statistics on Māori businesses: June 2024 quarter will be released on 8 October 2024.


