What is measured
This indicator measures the total volume of ice in glaciers greater than one hectare in area throughout Aotearoa New Zealand between 1978 and 2023. We also report trends across this time period.
Why it is important
A glacier is a large mass of ice created by the compression of snow that has piled up over many years. Usually, the ice is slowly moving downhill from the area of snow accumulation. Glaciers are iconic indicators of climate change (Mackintosh et al., 2017). Their fluctuations are amongst the clearest signals of climate change because glaciers are highly sensitive indicators of the earth's surface energy balance (Chinn, 1996). The amount of loss seen in two recent extreme mass-loss events for New Zealand glaciers was more likely to have occurred due to anthropogenic climate change (Vargo et al., 2020).
Glaciers provide an important natural resource that supports power generation, primary production, and water resources (Baumann et al., 2020). They act as a reservoir of water and are vital for plants and animals dependent on downstream rivers and lakes, particularly throughout drier seasons. Glaciers regulate downstream water temperature, which is important for many aquatic species, including taonga species. Changes to ice storage and melting can affect ecological and hydropower resources downstream, as well as important cultural values and tourism. Melting glaciers also add to coastal sea level rise, further contributing to the impacts of climate change (Bindoff et al., 2007; Oppenheimer et al., 2019).
Climate change is causing summer snowlines to rise and glaciers to retreat. A recent review of North Island glaciers showed that they had declined in area by 25 percent since 1988. For glaciers situated close to the limits of where they can exist, like those on Mt Ruapehu (the only North Island glacierised site today), even moderate warming scenarios predicted for the coming decades will probably lead to their extinction (Eaves & Brook, 2020). Mt Ruapehu is in the Tongariro National Park, which has been awarded UNESCO World Heritage status for its cultural and natural values. Ruapehu's glaciers serve as a cultural reference point for local iwi. For example, the Whangaehu River, which has been recognised as indivisible and a living being, emerges from the Whangaehu Glacier on the east flank of Mt Ruapehu. The loss of glaciers will have a negative impact on culture and historical kōrero.
Key findings
The total volume of glacial ice in New Zealand:
- decreased every year from 2018 to 2023
- decreased by 42 percent from 52.3 km3 to 30.3 km3 between 2005 and 2023, equivalent to the volume of 8.8 million Olympic-size swimming pools or 37 percent of the volume of Lake Taupō
- decreased by 6.5 percent (2.1 km3) between 1 April 2022 and 31 March 2023, equivalent to the volume of 848,000 Olympic-size swimming pools or 3.6 percent of the volume of Lake Taupō.
The highest annual ice loss occurred in 2018 with 2.7 km3 lost. The second highest annual ice loss occurred in both 2011 and 2019 with 2.6 km3 lost.
| Year | Ice volume (km³) |
| Mar-78 | 53.29 |
| Mar-79 | 52.31 |
| Mar-80 | 52.33 |
| Mar-81 | 52.55 |
| Mar-82 | 52.17 |
| Mar-83 | 52.99 |
| Mar-84 | 53.7 |
| Mar-85 | 54.21 |
| Mar-86 | 54.25 |
| Mar-87 | 54.42 |
| Mar-88 | 54.18 |
| Mar-89 | 54.03 |
| Mar-90 | 52.14 |
| Mar-91 | 52.37 |
| Mar-92 | 53.12 |
| Mar-93 | 53.97 |
| Mar-94 | 54.4 |
| Mar-95 | 55.43 |
| Mar-96 | 55.61 |
| Mar-97 | 56.45 |
| Mar-98 | 55.59 |
| Mar-99 | 53.26 |
| Mar-00 | 51.25 |
| Mar-01 | 51.83 |
| Mar-02 | 50.32 |
| Mar-03 | 50.92 |
| Mar-04 | 51.5 |
| Mar-05 | 52.28 |
| Mar-06 | 51.51 |
| Mar-07 | 51.34 |
| Mar-08 | 49.6 |
| Mar-09 | 48.23 |
| Mar-10 | 48.03 |
| Mar-11 | 45.47 |
| Mar-12 | 43.8 |
| Mar-13 | 43.84 |
| Mar-14 | 43.9 |
| Mar-15 | 43.11 |
| Mar-16 | 40.94 |
| Mar-17 | 41.11 |
| Mar-18 | 38.42 |
| Mar-19 | 35.87 |
| Mar-20 | 34.81 |
| Mar-21 | 34.27 |
| Mar-22 | 32.4 |
| Mar-23 | 30.28 |
| "Year" | "Annual change in ice volume (km³)" |
| "1979" | -0.98 |
| "1980" | 0.02 |
| "1981" | 0.22 |
| "1982" | -0.38 |
| "1983" | 0.82 |
| "1984" | 0.71 |
| "1985" | 0.51 |
| "1986" | 0.04 |
| "1987" | 0.17 |
| "1988" | -0.24 |
| "1989" | -0.15 |
| "1990" | -1.89 |
| "1991" | 0.23 |
| "1992" | 0.75 |
| "1993" | 0.85 |
| "1994" | 0.43 |
| "1995" | 1.03 |
| "1996" | 0.18 |
| "1997" | 0.84 |
| "1998" | -0.86 |
| "1999" | -2.33 |
| "2000" | -2.01 |
| "2001" | 0.58 |
| "2002" | -1.51 |
| "2003" | 0.6 |
| "2004" | 0.58 |
| "2005" | 0.78 |
| "2006" | -0.77 |
| "2007" | -0.17 |
| "2008" | -1.74 |
| "2009" | -1.37 |
| "2010" | -0.2 |
| "2011" | -2.56 |
| "2012" | -1.67 |
| "2013" | 0.04 |
| "2014" | 0.06 |
| "2015" | -0.79 |
| "2016" | -2.17 |
| "2017" | 0.17 |
| "2018" | -2.69 |
| "2019" | -2.55 |
| "2020" | -1.06 |
| "2021" | -0.54 |
| "2022" | -1.87 |
| "2023" | -2.12 |
Modelled trends
The modelled total volume of glacial ice in New Zealand very likely decreased between 2005 and 2023.
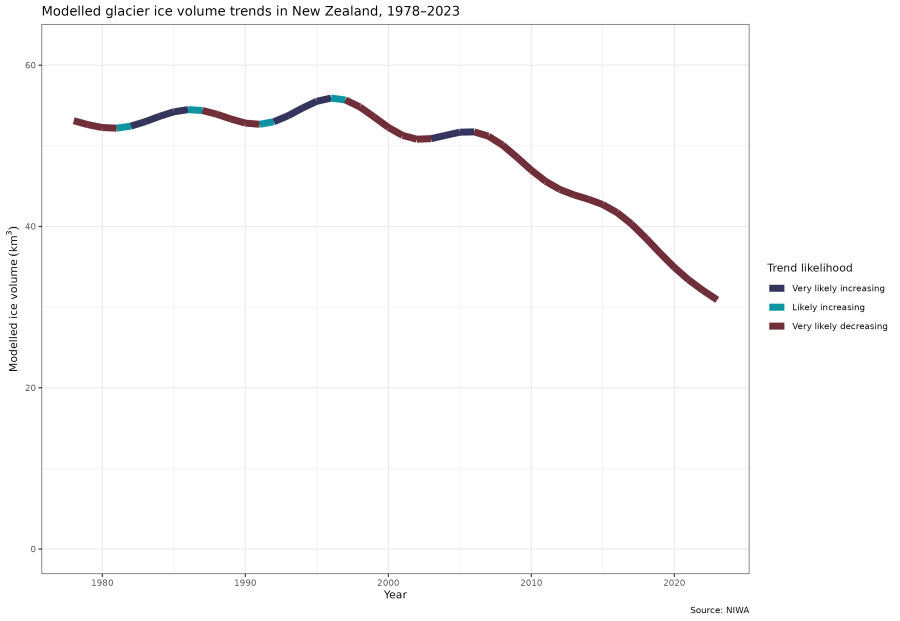
Text alternative for Modelled glacier ice volume trends in New Zealand, 1978-2023
A coloured line graph shows modelled values of glacier ice in km3 and trend likelihoods for modelled annual totals of glacier ice volumes in New Zealand between 1978 and 2023. The modelled values and trend likelihoods were calculated using a generalised additive model (GAM) to show how the trend in annual glacier ice volume changes within the time period. Trend likelihoods are coloured to indicate where the trend in ice volume is very likely increasing (dark blue), likely increasing (light blue), and very likely decreasing (dark red). The data is available from Modelled glacier ice volume trends, 1978-2023 (CSV, 2.8 KB).
Where this data comes from
NIWA
Related indicators
New Zealand's greenhouse gas emissions
Related content
Aotearoa New Zealand climate projections
Our atmosphere and climate 2023
Our atmosphere and climate 2020
Technical report
New Zealand Glacier Ice Volume 1978 - 2023
About the data
The glaciers described in this indicator are perennial areas of ice greater than 0.01 km2 (one hectare) as recorded in the New Zealand Glacier Inventory.
The annual total glacier ice volume is reported in water equivalents, using the units km3. A value of 0.9 was used to convert an ice volume to a water equivalent volume (Willsman, 2017).
The data used for this indicator were produced using a combination of two different methods. One method used geodetic survey information for the 12 large, low-angle glaciers that are largely covered in debris, including, for example, the Tasman Glacier. The other method, which deals mostly with small and medium-sized glaciers, used data from the End of Summer Snowline Survey (EOSS) combined with mass balance gradient data measured in-situ at the Brewster Glacier.
Annual glacier ice volumes: Data to 2023 DataInfo+ provides more information about these two methods.
Each glacial ice year runs from 1 April to 31 March and is referred to by the year at the end of the period (for example, the 2023 year runs from 1 April 2022 to 31 March 2023). The end of the glacial ice year is the best time to observe any remaining seasonal snow that has persisted on the glacier through the summer melt season.
The timeseries used in this indicator was adjusted by NIWA since it was last published. Previously, calculations used an accumulation rate, which is the rate of glacier gain from input and retention of snow and ice, of 7.1 mm/m for 11 of the index glaciers (glaciers that are regularly monitored and studied to provide details about variability and change of the cryosphere). The intended accumulation rate of 7.4 mm/m was applied to all index glaciers in this update. As a result, annual ice volumes are now slightly higher than corresponding values presented in the previously published indicator. New Zealand Glacier Ice Volume 1978 - 2023 provides more information about this correction.
The methods for calculating glacial ice volume make various assumptions and include potential sources of error that are associated with the following:
- The length of the ablation (glacier loss through melting, sublimation, or calving of snow and ice) season can vary considerably, but for practical reasons the EOSS is carried out in March.
- In some years the snowline can be obscured on glaciers and surrounding snow patches are used to estimate the altitude of the EOSS.
Errors from deriving the EOSS can correspond to an uncertainty in annual ice volume change of 0.23 to 1.15 km3 water equivalents (Chinn et al., 2012).
In addition to descriptive statistics, we are publishing results from a generalised additive model (GAM) in this indicator for the first time. A GAM was used to estimate a smooth trend over years to show how the trend in annual glacier ice volume changes between 1978 and 2023. No other variables were used in the model. We used the mgcv R package (Wood, 2011) to calculate the GAM using the default settings. We report trend likelihoods using categories describing the certainty of trends adapted from the Intergovernmental Panel on Climate Change (Mastrandrea et al., 2010). We classify trends as 'likely' when the probability of an increasing or decreasing trend is above 66 percent, and as 'very likely' when the probability is above 90 percent. We use the term 'indeterminate' when there is either no trend direction determined or not enough statistical certainty to determine trend direction (less than 66 percent certainty). We also report modelled ice volume values in km3 calculated at each year in the series.
Data quality
The accuracy of the data source is of high quality.
Annual glacier ice volumes is a direct measure of the 'Climate' and 'Climate and natural processes' topics and partial measure of the 'Sites of significance, including wāhi taonga and wāhi tapū' topic.
Stats NZ and the Ministry for the Environment must report on topics related to the five environmental domains: air, atmosphere and climate, fresh water, land, and marine. These topics identify key issues within each domain.
Topics for environmental reporting describes the topics for each domain.
Data quality has more information about the criteria we use to assess data quality.
References
Baumann, S., Anderson, B., Chinn, T., Mackintosh, A., Collier, C., Lorrey, A. M., ... & Eaves, S. (2021). Updated inventory of glacier ice in New Zealand based on 2016 satellite imagery. Journal of glaciology, 67(261), 13-26. https://doi.org/10.1017/jog.2020.78
Bindoff, N.L., Willebrand, J., Artale, V., Cazenave, A., Gregory, J., Gulev, S., Hanawa, K., Le Quéré, C., Levitus, S., Nojiri, Y., Shum, C.K., Talley, L.D., Unnikrishnan, A., 2007. Observations: oceanic climate change and sea level. In: Solomon, S., Qin, D., Manning, M., Chen, Z., Marquis, M., Averyt, K.B., Tignor, M., Miller, H.L. (Eds.), Climate Change 2007: The Physical Science Basis. Contribution of Working Group I to the Fourth Assessment Report of the Intergovernmental Panel on Climate Change. Cambridge University Press, Cambridge, United Kingdom and New York, NY, USA. https://www.ipcc.ch/report/ar4/wg1/
Chinn, T. J. (1996). New Zealand glacier responses to climate change of the past century. New Zealand Journal of Geology and Geophysics, 39(3), 415-428. https://doi.org/10.1080/00288306.1996.9514723
Chinn, T., Fitzharris, B., Willsman, A., & Salinger, M. (2012). Annual ice volume changes 1976-2008 for the New Zealand Southern Alps. Global and Planetary Change, 92-93, 105-118.
https://doi.org/10.1016/j.gloplacha.2012.04.002
Eaves, S. R., & Brook, M. S. (2020). Glaciers and glaciation of North Island, New Zealand. New Zealand Journal of Geology and Geophysics, 64(1), 1-20. https://doi.org/10.1080/00288306.2020.1811354
Mackintosh, A. N., Anderson, B. M., Lorrey, A. M., Renwick, J. A., Frei, P., & Dean, S. M. (2017). Regional cooling caused recent New Zealand glacier advances in a period of global warming. Nature Communications, 8(1). https://doi.org/10.1038/ncomms14202
Mastrandrea, M. D., Field, C. B., Stocker, T. F., Edenhofer, O., Ebi, K. L., Frame, D. J., Held, H., Kriegler, E., Mach, K. J., Matschoss, P. R., Plattner, G.-K., Yohe, G. W., & Zwiers, F. W. (2010). Guidance Note for Lead Authors of the IPCC Fifth Assessment Report on Consistent Treatment of Uncertainties. Intergovernmental Panel on Climate Change (IPCC). https://www.ipcc.ch/site/assets/uploads/2018/05/uncertainty-guidance-note.pdf
Oppenheimer, M., B.C. Glavovic, J. Hinkel, R. van de Wal, A.K. Magnan, A. Abd-Elgawad, R. Cai, M. Cifuentes-Jara, R.M. DeConto, T. Ghosh, J. Hay, F. Isla, B. Marzeion, B. Meyssignac, and Z. Sebesvari, 2019: Sea Level Rise and Implications for Low-Lying Islands, Coasts and Communities. In: IPCC Special Report on the Ocean and Cryosphere in a Changing Climate [H.-O. Pörtner, D.C. Roberts, V. Masson-Delmotte, P. Zhai, M. Tignor, E. Poloczanska, K. Mintenbeck, A. Alegría, M. Nicolai, A. Okem, J. Petzold, B. Rama, N.M. Weyer (eds.)]. Cambridge University Press, Cambridge, UK and New York, NY, USA, pp. 321-445. https://doi.org/10.1017/9781009157964.006
Vargo, L. J., Anderson, B. M., Dadić, R., Horgan, H. J., Mackintosh, A. N., King, A. D., & Lorrey, A. M. (2020). Anthropogenic warming forces extreme annual glacier mass loss. Nature Climate Change, 10(9), 856-861. https://doi.org/10.1038/s41558-020-0849-2
Willsman, A. (2017). Annual glacier ice volumes, 1977-2016 (NIWA Client Report No: 2017127EI). NIWA. https://environment.govt.nz/publications/annual-glacier-ice-volumes-19772016/
Wood, S. N. (2011). Fast stable restricted maximum likelihood and marginal likelihood estimation of semiparametric generalized linear models. Journal of the Royal Statistical Society (B), 73(1), 3-36.
Archived pages
Archived April 2025:
Annual glacier ice volumes - published February 2022


