In the wake of the COVID-19 pandemic, New Zealand's population growth slowed down with Auckland recording a population decline for the first time ever, Stats NZ said today.
"New Zealand saw slowing population growth in all regions," population estimates and projections manager Hamish Slack said.
"COVID-19 international travel restrictions continued to curb population increases from international migration in the June 2021 year."
Nationally, the population growth rate dropped from 2.2 percent in the June 2020 year to 0.6 percent in the June 2021 year, the lowest it has been since the June 2012 year . The population decreased in the Auckland, West Coast, and Southland regions, and other regions experienced lower growth. In contrast, all regions had population growth in the June 2020 year.
"While the population decrease in the Auckland region was just 1,300 or 0.1 percent in 2021, this was still a significant change," Mr Slack said.
"The Auckland region has averaged population growth of 1.8 percent a year over the previous 20 years, higher than the national average growth of 1.4 percent a year."
Auckland's population is provisionally estimated as 1.72 million at 30 June 2021.
The fastest growing regions in the June 2021 year were Northland with a growth rate of 1.9 percent, and Tasman and Bay of Plenty, both growing at 1.5 percent. The population growth in these three regions was mainly driven by people moving there from other areas of the country.
| Region | Percent change 2020 | Percent change 2021 |
| Northland | 2.8 | 1.9 |
| Tasman | 3.8 | 1.5 |
| Bay of Plenty | 3.1 | 1.5 |
| Waikato | 2.8 | 1.3 |
| Hawke's Bay | 2.7 | 1 |
| Marlborough | 3.4 | 1 |
| Taranaki | 1.8 | 1 |
| Canterbury | 2 | 0.9 |
| Otago | 2.2 | 0.9 |
| Manawatū-Whanganui | 1.6 | 0.8 |
| Wellington | 2 | 0.7 |
| Gisborne | 1.8 | 0.6 |
| NEW ZEALAND | 2.2 | 0.6 |
| Nelson | 2.4 | 0.1 |
| Auckland | 2.1 | -0.1 |
| Southland | 1.2 | -0.1 |
| West Coast | 0.9 | -0.2 |
Population changes in Auckland local board areas
Although Auckland region's population declined slightly overall, its northernmost and southernmost areas still grew significantly. The southern Papakura and Franklin local board areas grew 3.7 percent and 1.7 percent respectively in the June 2021 year. Meanwhile the northern Rodney local board area increased by 3.0 percent. These three high-growth local board areas gained most of their population increase from people moving into those areas from other parts of Auckland and New Zealand.
The population of Aotea/Great Barrier Island grew by 2.3 percent and Manurewa by 1.5 percent, while all other local board areas either grew by less than 1 percent or experienced a population decline. The population change in local board areas with declining populations was driven mostly by people moving to other areas of Auckland or New Zealand. The local board areas with the largest population declines were Waitematā (-4.2 percent) and Albert-Eden (-2.1 percent).
Population changes outside Auckland
Outside Auckland, the territorial authority area with the largest population growth was Selwyn district (up 3,400 people or 4.8 percent). This was followed by Tauranga city (up 3,100 or 2.0 percent) and Waikato district (up 2,200 or 2.6 percent). The increases in areas with the largest population growth were generally driven by migration from other areas of New Zealand. However, Hamilton city's growth was largely due to natural increase (births minus deaths).
| Area | Natural increase | Net internal migration | Net international migration |
| Selwyn district | 720 | 2600 | 40 |
| Tauranga city | 750 | 2000 | 310 |
| Waikato district | 620 | 1300 | 180 |
| Whangārei district | 420 | 840 | 360 |
| Hamilton city | 1700 | -40 | -70 |
| Waimakariri district | 160 | 1200 | 70 |
| Far North district | 180 | 850 | 290 |
| Western Bay of Plenty district | 230 | 790 | 120 |
| Hastings district | 420 | 270 | 330 |
| Waipa district | 190 | 640 | 130 |
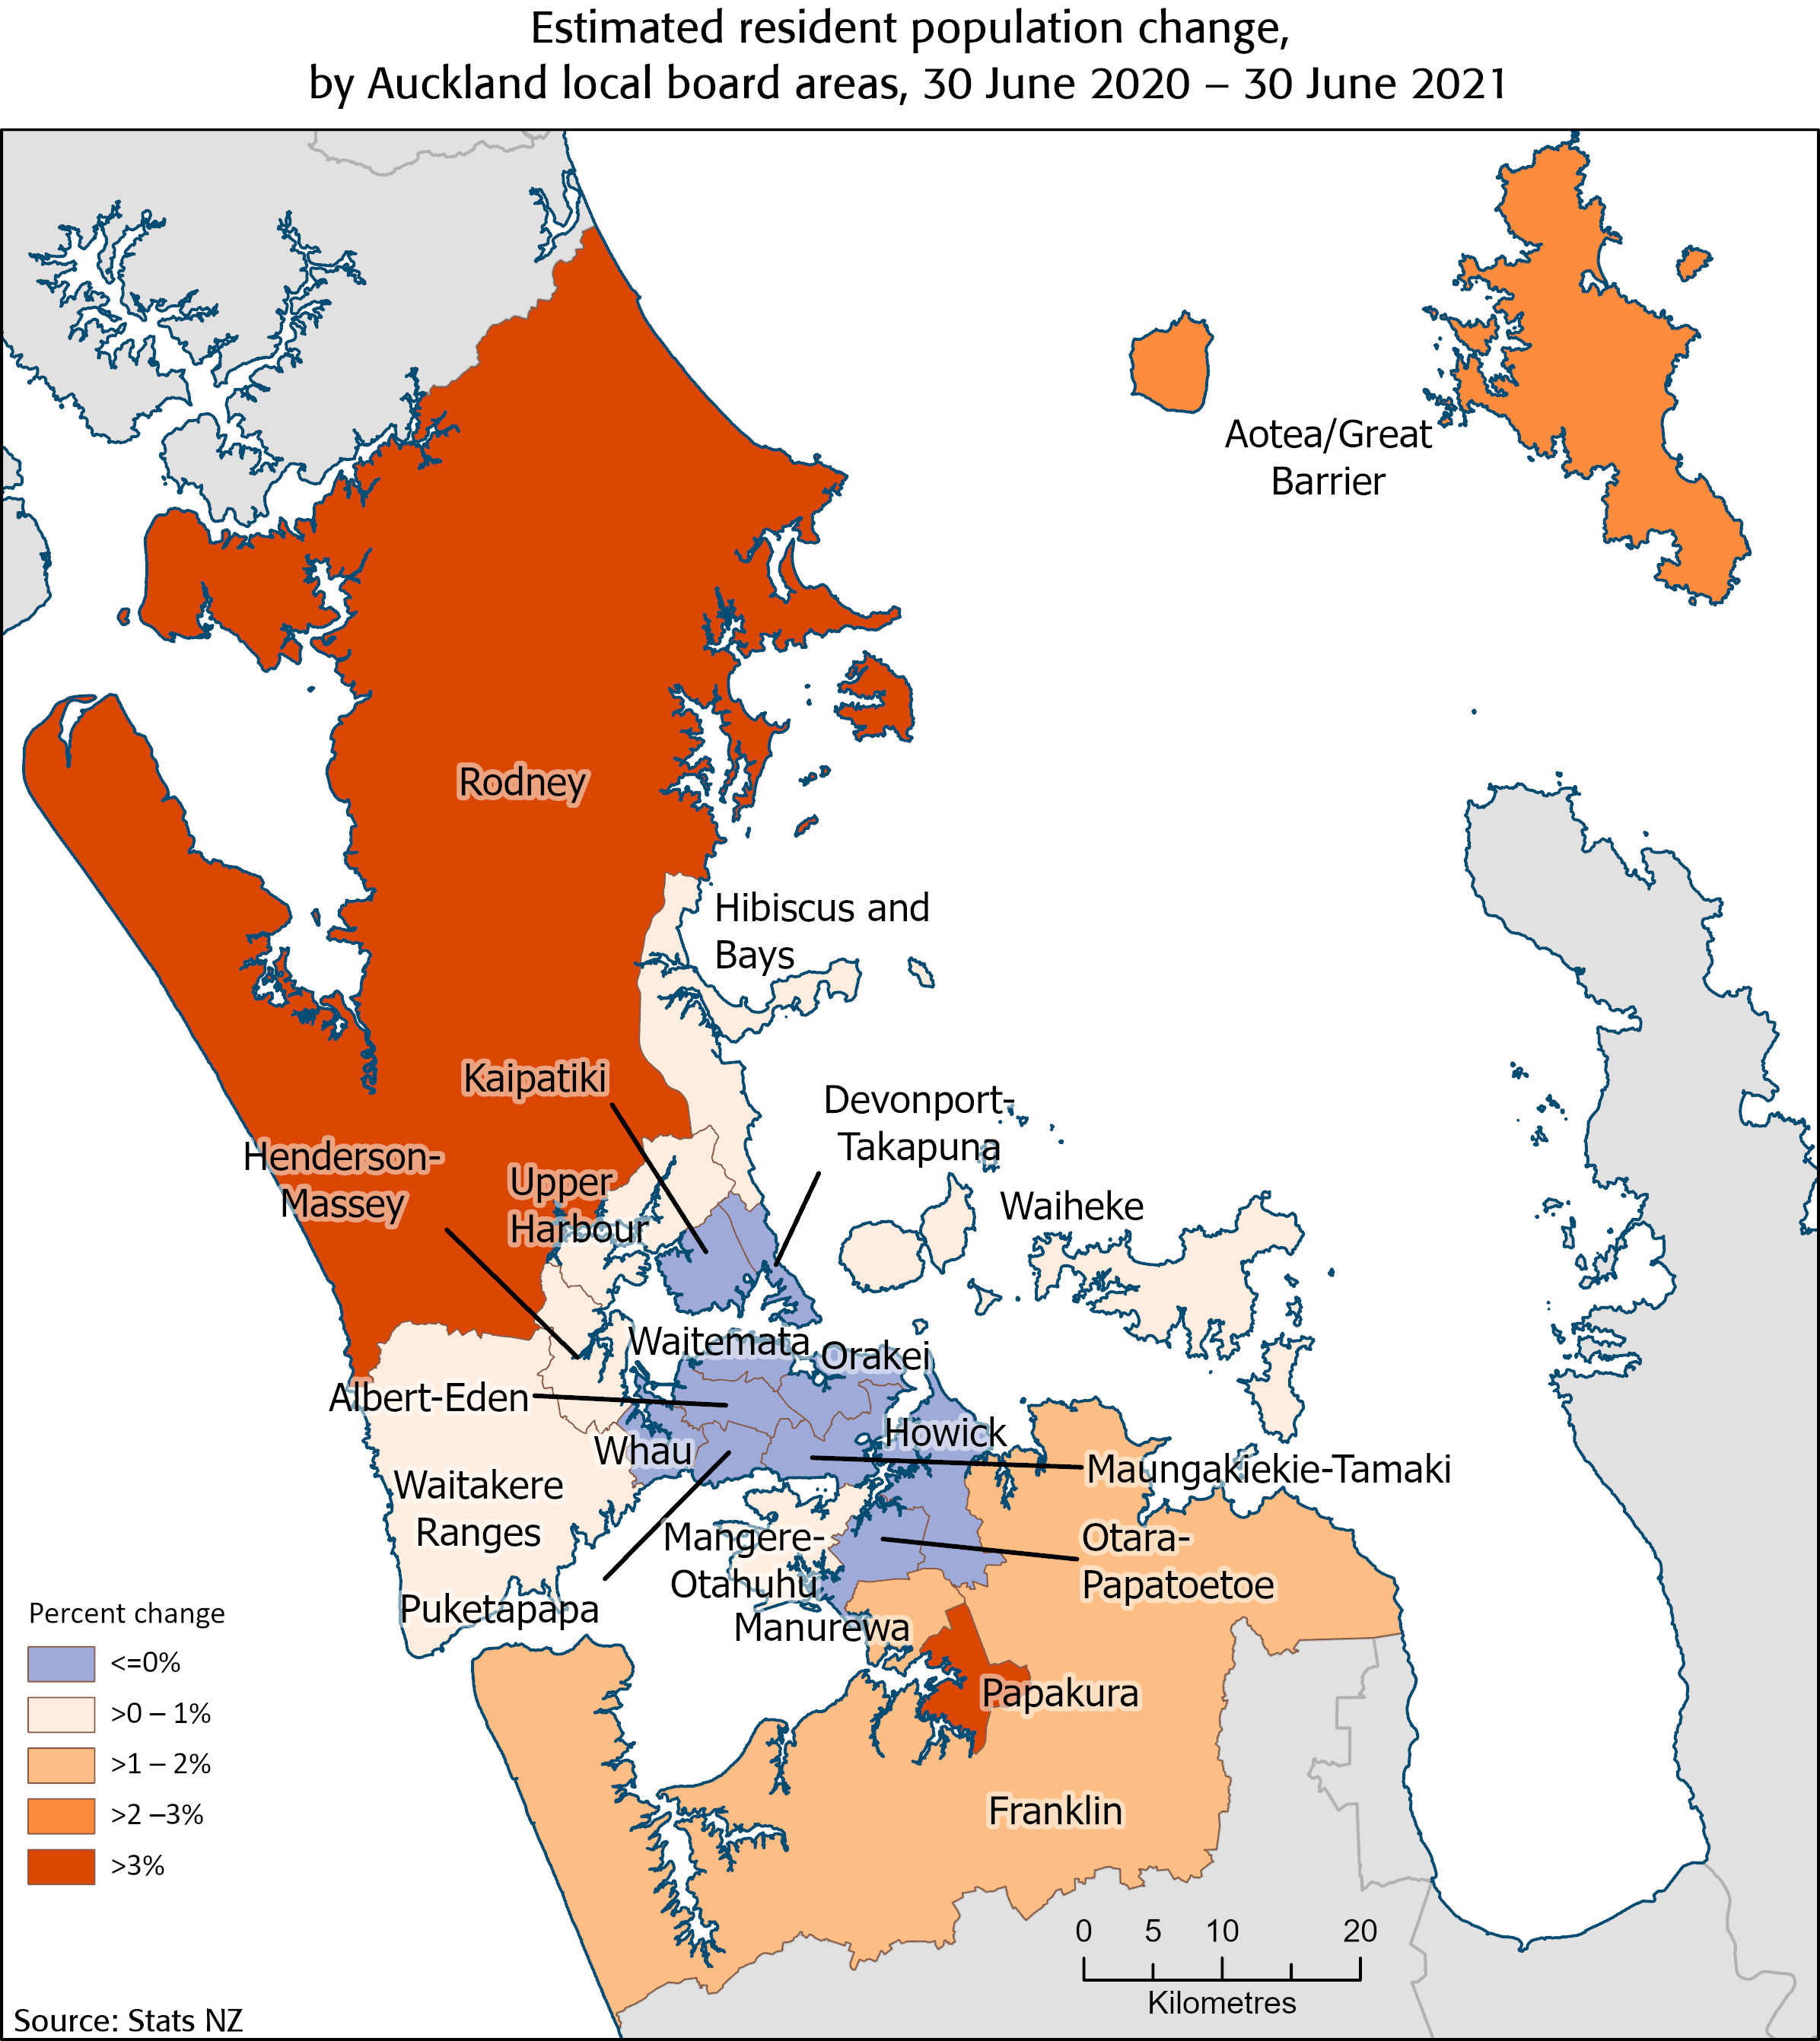
Text alternative for map Estimated resident population change, by Auckland local board areas, 30 June 2020-30 June 2021
The map shows the Auckland local board areas, each of which is assigned a colour to show the range of change in estimated resident population in the year ended 30 June 2021. The colours are grouped into annual percent change 2020-2021 of: less than zero; greater than zero to one percent; greater than one to two percent; greater than two to three percent; greater than three percent. The annual change ranged from 3.7 percent growth in Papakura local board area to 4.2 percent decline in Waitematā local board area. Data is available from Subnational population estimates (TA, SA2), by age and sex, at 30 June 1996-2021 (2021 boundaries).


