Within the next 30 years, a highly destructive Nankai Trough megathrust earthquake is predicted to hit southwest Japan. Understanding long-term slow slip events (L-SSE*1) that occur along the plate interface between the subducting Philippine Sea plate and overriding Amurian plate under the Bungo Channel is essential for pinpointing when such an earthquake will happen. To this end, Kobe University's Professor YOSHIOKA Shoichi (Research Center for Urban Safety and Security) and SESHIMO Yukinari (1st year Masters student, Department of Planetology, Graduate School of Science) analysed the 2018-2019 Bungo Channel L-SSE using longitudinal GNSS data*2 provided by the Geospatial Information Authority of Japan.
They revealed that even though the 2018-2019 event was shorter than past L-SSEs in this region, it was also bigger in terms of slippage amount and slip velocity, as well as seismic moment and moment magnitude. This and their other findings provide further insight into the behaviour of L-SSEs in the Bungo Channel.
These results were publicized in the online journal 'Scientific Reports' on January 10, 2022 at 10 am GMT. This journal is published by the Nature Publishing Group (UK).
Main points
- Illuminating slow slip distribution in the Bungo Channel is important for understanding the causal mechanism behind a Nankai Trough megathrust earthquake, which has been predicted to occur in the near future.
- This research group illuminated the spatiotemporal distribution of the slow slip event that occurred in 2018-2019
- Despite taking place over the shortest time period, the 2018-2019 event was the highest recorded so far in terms of slippage amount and slip velocity, as well as seismic moment*3 and moment magnitude*4 compared to past slow slip events in the Bungo Channel.
- The 2018-2019 event resembled the 2002-2004 slow slip in terms of starting location, slip distribution and the order in which sub-events occurred.
Research Background

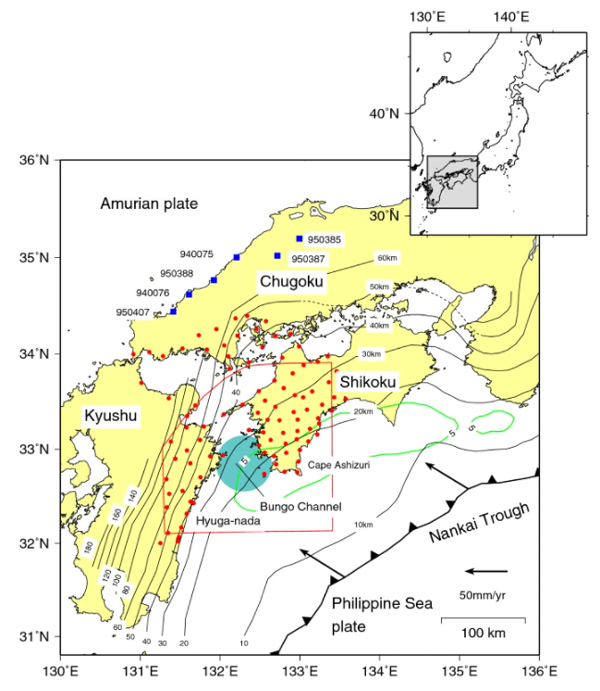
Figure 1: Tectonic map of the area around the Bungo Channel
The Philippine Sea plate is subducting in a north-westerly direction beneath the Amurian plate. Red dots represent the GNSS stations used in the analysis. The red line is a horizontal projection of the analyzed area. The large blue circle indicates the general location where Bungo Channel L-SSE occurred.
In the Bungo Channel, which is located between Shikoku and Kyushu in southwest Japan, the Philippine Sea plate is subducting in a north-westerly direction beneath the Amurian plate. Every 6 or so years, long-term slow slip events (L-SSE) repeatedly occur along the plate interface beneath this region. Each of these L-SSEs last between several months to a couple of years.
Studies conducted up until now have analyzed the slip distributions of L-SSEs that occurred in the following periods: 1996-1998, 2002-2004, and 2009-2011. It has been indicated that there is a possible relationship between these events and the occurrence of a Nankai Trough megathrust earthquake.
Illuminating the slip distributions of L-SSE in the Bungo Channel is considered vital for understanding how such a megathrust earthquake occurs. Therefore, Kobe University researchers decided to conduct a new analysis of the L-SSE that happened during the 2018-2019 period.
Research Methodology and Findings
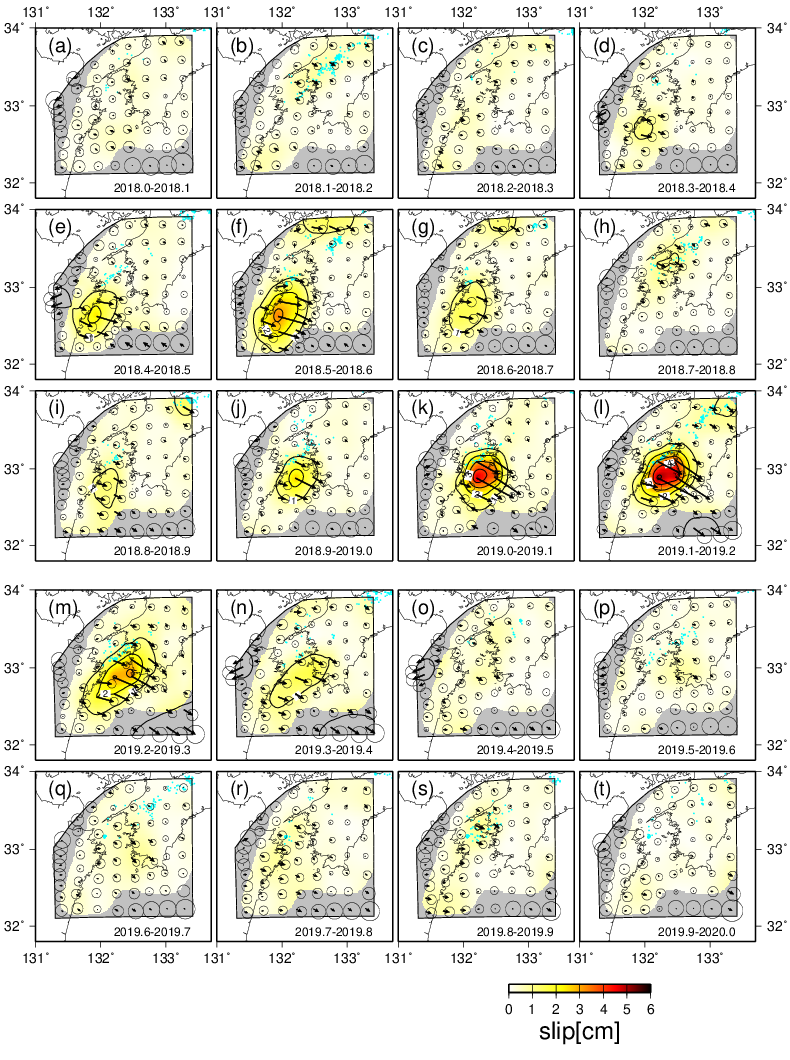
Using longitudinal GNSS data, the researchers calculated the spatiotemporal distribution of the Bungo Channel L-SSE that occurred in 2018-2019. From the results, they understood that this event could be divided into 2 sub-events; the 1st sub-event spanning March to July 2018 (0.1 of a year = 36.5 days) and occurring under the southwest side of the Bungo Channel, and the 2nd sub-event that occurred from August 2018 to April 2019 directly beneath the central part of the Channel.
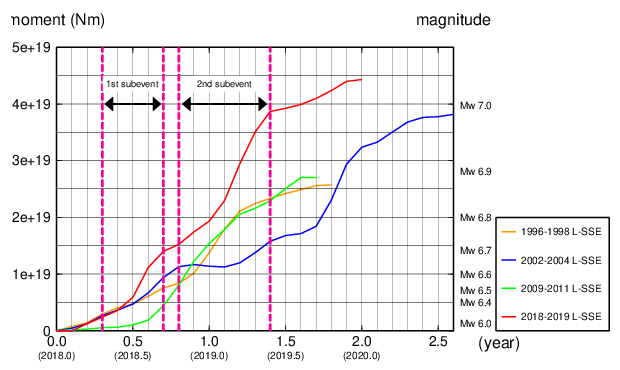
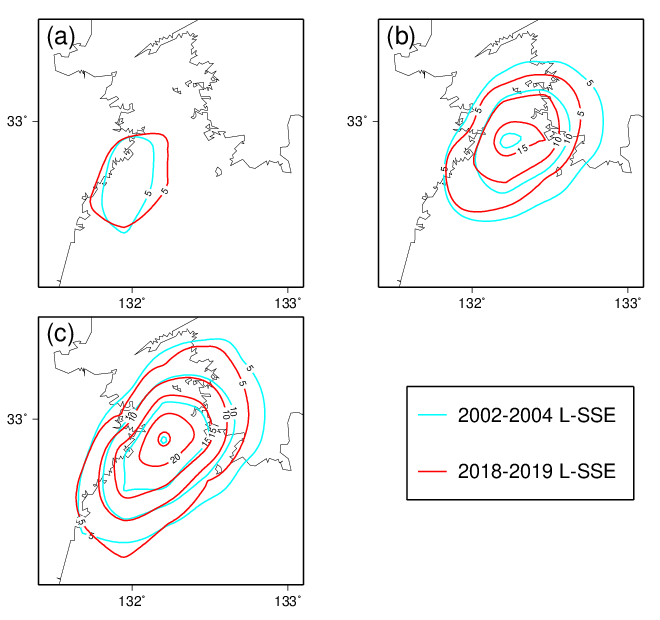
The 2018-2019 L-SSE, at one year in duration, lasted for the shortest length of time compared to past Bungo Channel L-SSEs that have been analyzed. Despite this, the 2018-2019 L-SSE was the biggest event in terms of slippage amount and slip velocity, as well as seismic moment and moment magnitude. Furthermore, the researchers also discovered that the 2018-2019 L-SSE was similar to the 2002-2004 L-SSE in terms of starting location, slip distribution and the order in which sub-events occurred. In the past, there have been intervals of approx. 6 years between the occurrence of each L-SSE, however the 2018-2019 L-SSE took place around 8 years after the previous event, which was in 2009-2011.

Figure 2: Slip distribution of the 2018-2019 Bungo Channel L-SSE
Shows the continuous analysis results for every 0.1 year= 36.5 day period. The arrows denote the direction and amount of slippage for the overriding plate against the subducting plate at the plate interface. The color contours indicate the amount of slippage with intervals of 1cm. Grey indicates the areas for which the dependability of the analysis results is low.

Figure 3: Dual axis chart to show the temporal development of 4 Bungo Channel L-SSEs in terms of seismic moment (left y-axis) and moment magnitude (right y-axis).
Yellow: 1996-1998 L-SSE, Blue: 2002-2004 L-SSE, Green: 2009-2011 L-SSE, Red: The 2018-2019 L-SSE uncovered by this study. The graph shows the temporal development of each L-SSE's seismic moments and moment magnitude. The pink dotted lines indicate the periods during which the 2018-2019 L-SSE's two sub-events occurred.

Figure 4: Spatial distribution of the amount of slippage during the 2002-2004 Bungo Channel L-SSE and the 2018-2019 Bungo Channel L-SSE.
Blue (2002-2004) and red lines (2018-2019) show the 5cm contour intervals between the two L-SSEs. (a) is the spatial distribution of the slippage amount for the 1st sub-event, (b) is the 2nd sub-event. (c) shows the overall spatial distribution of slippage for both L-SSEs.
Further Research
The Bungo Channel L-SSEs have taken place at the downdip of the plate interface adjacent to the hypocenter of the Nankai Trough megathrust earthquake, which is estimated to occur with a 70~80% probability in the next 30 years. Monitoring the spatiotemporal changes in the behaviour of these kinds of slow earthquake*5 is vital for enabling seismologists to detect the early signs of a megathrust earthquake. These observations have revealed spatiotemporal changes in the slip distribution of the 2018-2019 Bungo Channel L-SSE, highlighting the great importance of comparing recent L-SSE with past events. Next, the researchers will monitor the slippage and adhesion where the plates intersect beneath the Bungo Channel. By furthering their analysis, they hope to illuminate the mechanisms by which earthquakes occur and to enable the early detection of the coming Nankai Trough megathrust earthquake.
Glossary
- *1 Long-term slow slip event (L-SSE)
- This phenomenon occurs at a subduction interface (where one plate is thrust beneath another). Over a period ranging from a few months to a few years, part of the plate interface slowly slips- this is an L-SSE.
- *2 Longitudinal GNSS data
- The Geospatial Information Authority of Japan has around 1300 GNSS (Global Navigation Satellite System) stations located throughout Japan that collect temporal data on seismic shifts.
- *3 Seismic moment
- This is a measure of an earthquake's size based on the area of fault rupture, the average amount of slip, and the force that was required to overcome the friction sticking the rocks together
- *4 Moment magnitude
- Magnitude that is calculated based on long seismic waves (that have a duration of over 10 seconds) and the shape of these waves. It can also be determined from seismic moments
- *5 Slow earthquake
- An earthquake phenomenon in which a fault rupture gradually occurs. Slow earthquake is a general term for a variety of time constant phenomena where a fault slips; including low frequency earthquakes, ultra-low frequency tremors and earthquakes, and short-term and long-term slow slip events.
Journal Information
- Title
- "Spatiotemporal slip distributions associated with the 2018-2019 Bungo Channel long-term slow slip event inverted from GNSS"
- DOI:10.1038/s41598-021-03982-6
- Authors
- Yukinari Seshimo1、 Shoichi Yoshioka2,1
- 1. Department of Planetology, Graduate School of Science, Kobe University
2. Research Center for Urban Safety and Security, Kobe University.
- Journal
- Scientific Reports (Nature Publishing Group)


