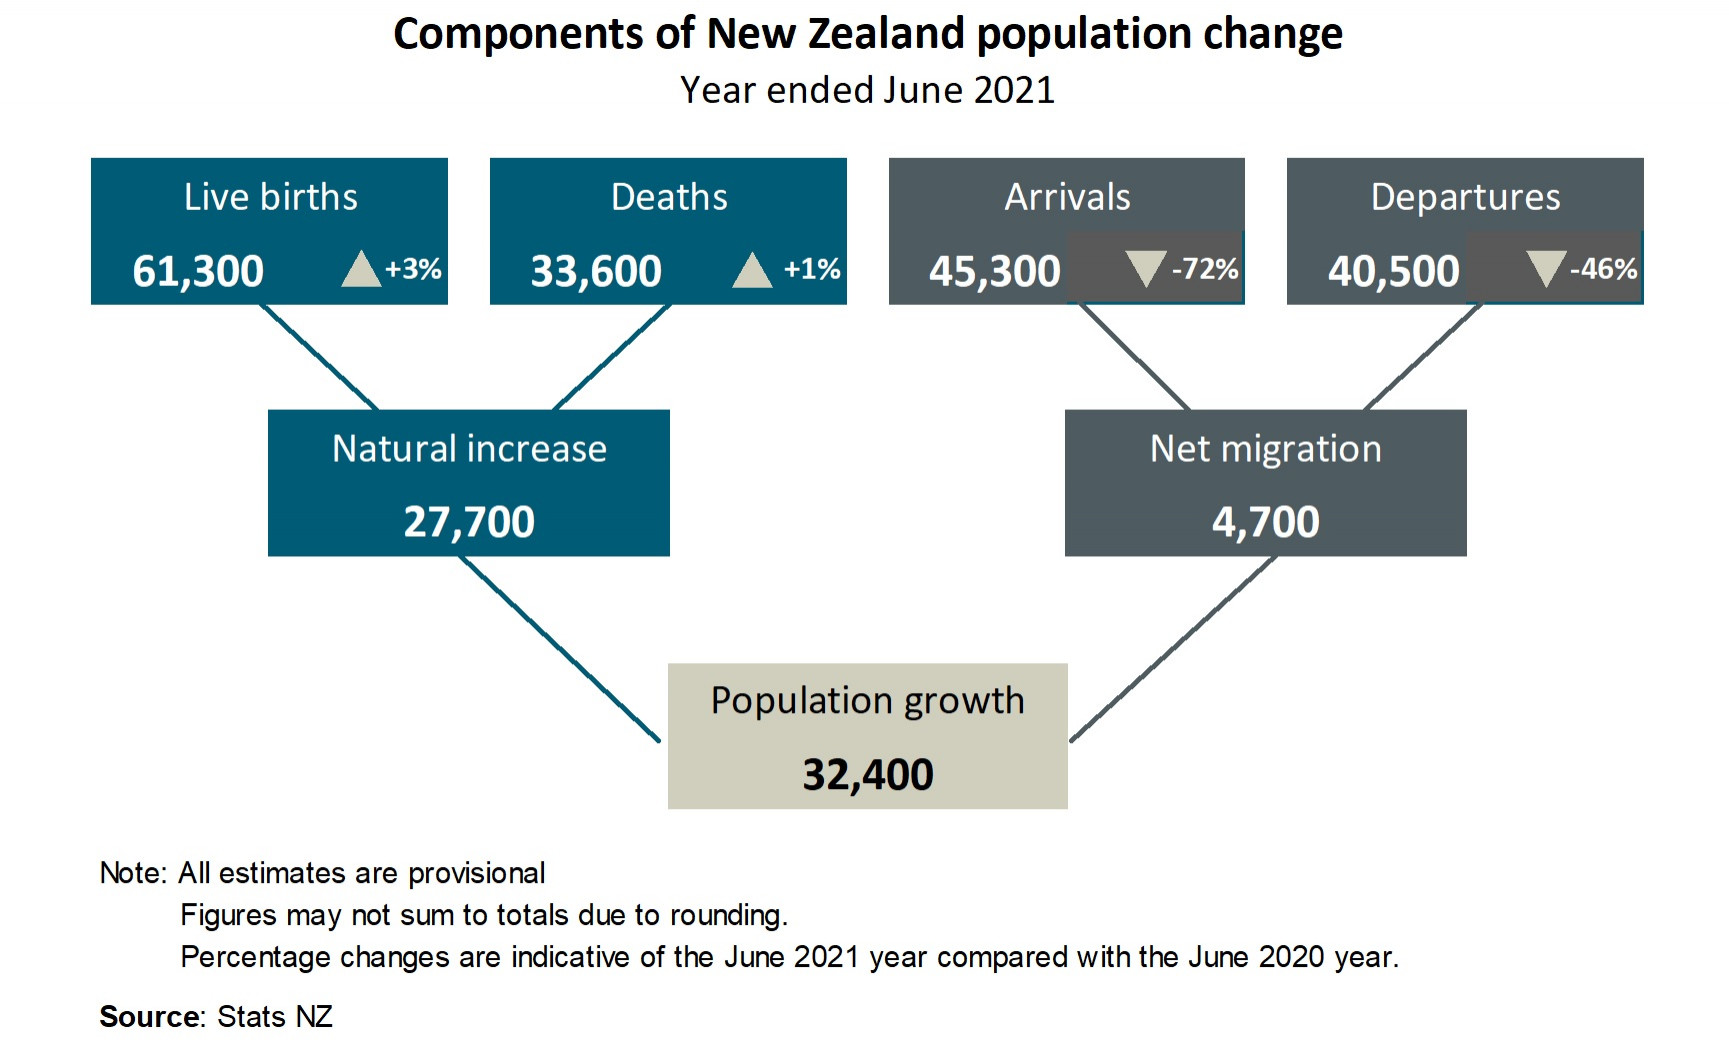
For the first June year since 2013, natural increase (births minus deaths) was the main driver of annual population growth, Stats NZ said today.
New Zealand's population provisionally grew by 32,400 people, or 0.6 percent, to reach 5.12 million at 30 June 2021. This is the first full June year during the COVID-19 pandemic, where border closures and travel restrictions reduced net migration, giving the lowest annual growth since June 2012 (when the population grew by 0.5 percent).
"Net migration has been the main driver of New Zealand's population growth in recent years, but for the June 2021 year, natural increase was nearly six times higher than the contribution from net migration," population estimates and projections manager Hamish Slack said.
The impacts of COVID-19 on international travel has resulted in a provisional net migration gain of 4,700 for the year ended June 2021, the lowest since 2013. International migration: June 2021 has more information on net migration.
New Zealand's population change is a combination of natural increase (births minus deaths) and net migration (migrant arrivals minus migrant departures).

Text alternative for Components of New Zealand population change, year ended June 2021
Diagram shows population change for the year ended June 2021. Overall, population growth is 32,400, made up of a net gain of 27,700 natural increase (based on 61,300 live births, and 33,600 deaths) and a net migration of 4,700 (based on 45,300 migrant arrivals and 40,500 migrant departures). All estimates are provisional.
Population aged 65 years and over growing fastest
Although the smallest of the broad age groups, people aged 65 years and over were the fastest growing age group, up 3.43 percent, or 27,200 people, in the June 2021 year. Most of this increase was a result of people born in the mid-1950s turning 65 and moving into this age group.
In contrast, the number of people aged 15-39 years shrank by 0.27 percent, or 4,700 people. This drop mainly reflects more people moving out of this age group (to older ages) than moving into this age group (from younger ages).
These changes follow recent and projected trends. National population projections: 2020(base)-2073 has more information available on the projected population of New Zealand.
| At 30 June | 0-14 years | 15-39 years | 40-64 years | 65 years and over |
| 1991 | 807200 | 1399100 | 897500 | 391300 |
| 1992 | 814300 | 1402500 | 915300 | 399600 |
| 1993 | 824700 | 1405700 | 934100 | 407800 |
| 1994 | 835300 | 1412200 | 956600 | 415900 |
| 1995 | 847500 | 1421100 | 981400 | 423400 |
| 1996 | 859500 | 1433900 | 1008500 | 430100 |
| 1997 | 869500 | 1437200 | 1038300 | 436300 |
| 1998 | 876300 | 1429600 | 1067000 | 442200 |
| 1999 | 877300 | 1413600 | 1096200 | 447900 |
| 2000 | 878700 | 1400700 | 1124900 | 453500 |
| 2001 | 877200 | 1388800 | 1153900 | 460600 |
| 2002 | 883600 | 1405700 | 1191800 | 467500 |
| 2003 | 890000 | 1430700 | 1230900 | 475700 |
| 2004 | 893100 | 1443400 | 1266400 | 484600 |
| 2005 | 890200 | 1452100 | 1295200 | 496400 |
| 2006 | 888300 | 1463700 | 1321000 | 511600 |
| 2007 | 891300 | 1463700 | 1343500 | 525300 |
| 2008 | 895500 | 1460400 | 1368800 | 535000 |
| 2009 | 901100 | 1461000 | 1392100 | 548300 |
| 2010 | 908100 | 1464600 | 1414400 | 563500 |
| 2011 | 910700 | 1459100 | 1434100 | 580100 |
| 2012 | 909800 | 1450500 | 1444700 | 603000 |
| 2013 | 908800 | 1452300 | 1455000 | 626000 |
| 2014 | 911700 | 1484500 | 1471700 | 648500 |
| 2015 | 916200 | 1533800 | 1489200 | 670200 |
| 2016 | 924600 | 1590000 | 1507500 | 692000 |
| 2017 | 936800 | 1637100 | 1525800 | 713800 |
| 2018 | 946400 | 1676900 | 1542300 | 734900 |
| 2019 | 956000 | 1705600 | 1557700 | 759800 |
| 2020 | 966400 | 1750100 | 1581800 | 791900 |
| 2021 | 968600 | 1745400 | 1589500 | 819100 |
The population at 30 June 2021 included 2.54 million males and 2.58 million females, with the number of females growing slightly faster than males in the last year (0.66 and 0.61 percent respectively).


