Mapping cellular turnover sheds light on the balance between renewal and stability in our bodies
One of the earliest thought experiments in history asked whether the ship commanded by the legendary king Theseus could have its old timber replaced, piece by piece, and still remain the same ship. At some point would it actually be a new ship? Our bodies are something like Theseus' ship, steadily turning over cells so that as we age, we can say that few of the original "planks" are left. In our bodies, some cells never get replaced, while others are exchanged on practically a daily basis. What does the overall picture of cell replacement look like? For biomedical research, that is more than a philosophical question, as it touches on numerous processes in the body, from metabolic health to cancer.

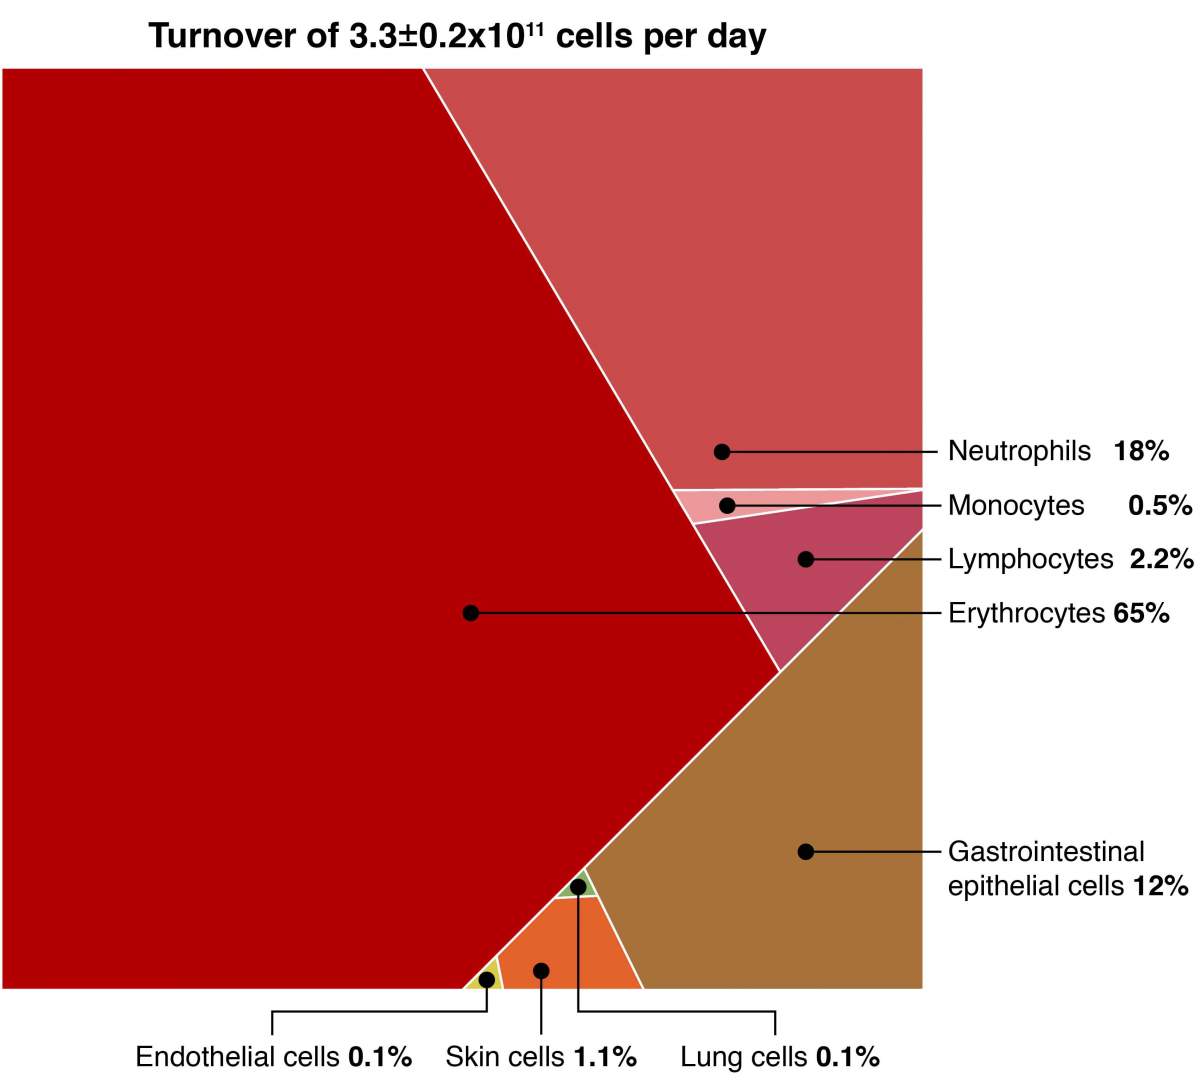
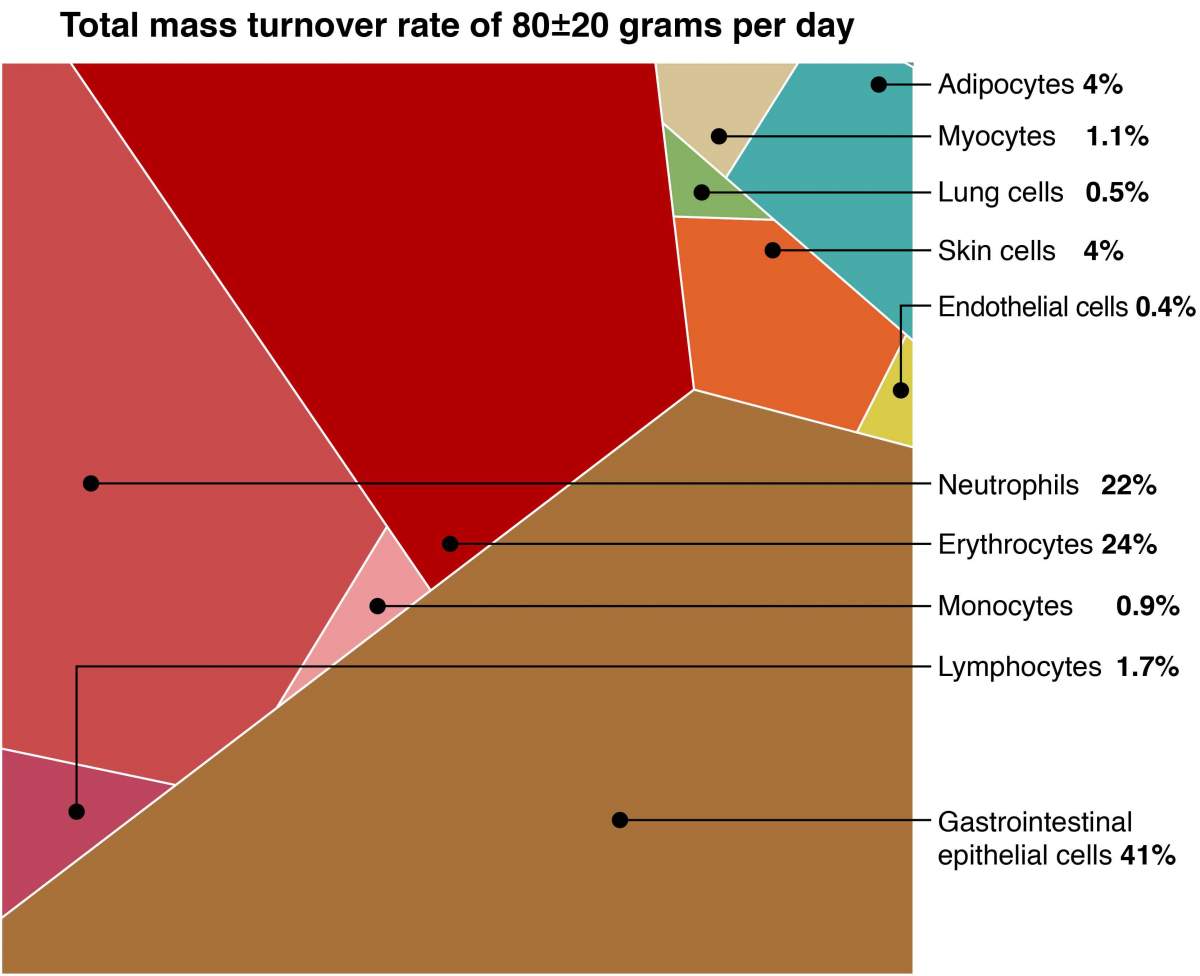
Prof. Ron Milo and research student Ron Sender of the Weizmann Institute of Science's Plant and Environmental Sciences Department went about this issue using a biological census method developed in Milo's group. Of the 30 trillion cells in an adult body, Milo and Sender first selected a number of the most prevalent, representative types, with red blood cells and the epithelial cells lining the intestinal tract at the high end of the turnover scale, the non-renewable brain cells and cardiac cells at the other extreme. Then, using the available statistics for each, they created comparative maps to show, at a glance, how many types, and how much of each type of the cells in the body die and get replaced over time - by numbers as well as by weight.
Roughly every 80 days our bodies produce a number of new cells roughly equal to the total number in the body
In the final tally, around 330 billion cells die and roughly the same number of new ones are born every day. By numbers, red and white blood cells - which live between one day and several months - are by far the largest portion, accounting for some 90%, of that turnover. Blood cells are quite light, so by mass, the daily total comes out to something a bit less than a hundred grams. Thus roughly every 80 days our bodies produce a number of new cells roughly equal to the total number in the body. However, in terms of mass, we create our weight in new cells every year and a half (not seven, as some have suggested).
When the cells are compared by the overall weight of cells that get turned over, blood cells still come out on top, but less so. Gut epithelial cells, which are much larger than blood cells, are a fair second, accounting for about 12% by numbers but 40%, by weight, and getting replaced, on average, every few days. By mass, fat cells and skin cells trail far behind, each accounting for around 4% of the total daily turnover, with lung cells making up only half a percent.

And the researchers did not forget another component of our body mass: The few hundred grams of gut bacteria we carry with us have an extremely high replacement rate of around 100 grams a day.
"These maps can now provide a baseline for a healthy adult," says Milo. "We can, in the future, use them to explore, on the one hand, how the ratios change during growth and development and, on the other, how the balance between life and death in cell turnover is upset in cancer and many other diseases. In the future we might be able to develop diagnostic tests for determining unhealthy levels of turnover in certain cell types that could provide early signs of disease, or apply the findings to answering questions concerning the ways that cancer upsets this balance
"Our study gives a fresh quantitative perspective on the classic question of the 'Theseus ship' of the body, showing you can learn a lot by paying close attention to the numbers. Our body is both new and the same in a way we can now quantify, undergoing constant change through the process of cell turnover and yet keeping the same ratios of cells that preserve the same basic form and function."
Prof. Ron Milo is Head of the Mary and Tom Beck - Canadian Center for Alternative Energy Research; his research is also supported by the Zuckerman STEM Leadership Program; the Larson Charitable Foundation New Scientist Fund; the Ben B. and Joyce E. Eisenberg Foundation; the Yotam Project; the Ullmann Family Foundation; Dana and Yossie Hollander; Sonia T. Marschak; and the European Research Council. Prof. Milo is the incumbent of the Charles and Louise Gartner Professorial Chair.


