New 2023 Census data in Commuter Waka's interactive map shows how we are choosing to commute in Aotearoa New Zealand, Stats NZ said today.
"Commuter Waka gives a comprehensive view of commuter data, allowing us to see where people are travelling to and from for work and education, and how they choose to travel," 2023 Census spokesperson Kathy Connolly said.
"With the addition of the 2023 Census data, you can now see how commuter trends are changing over time." In 2020, Stats NZ ran a competition to create an interactive data visualisation using the 2018 Census commuter dataset. The winning entry, Commuter Waka, is a data visualisation tool that uses an interactive map and series of graphs to show commuter information for areas across New Zealand.
Explore commuter flows
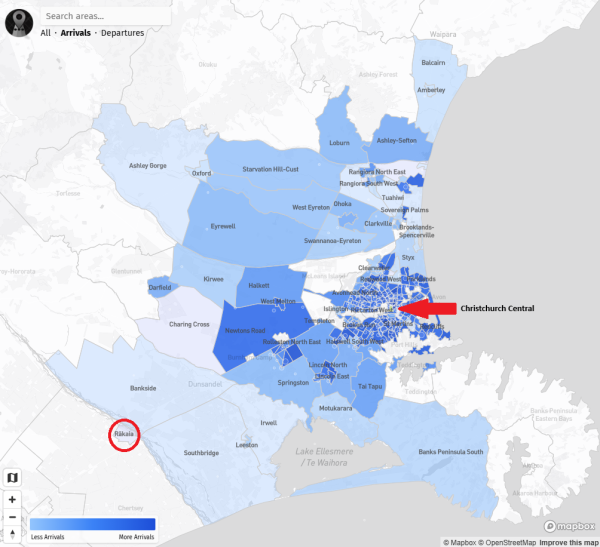
The dynamic map shows where people arriving in an area for work or study are travelling from, and which journeys are more common. For example, for the population who worked in Christchurch Central in 2023, a high number of people commuted from other areas within Christchurch (shown by the cluster of dark blue areas on the map). Smaller numbers of arrivals into Christchurch Central from outlying areas, such as Rākaia, are indicated by the pale blue areas.
Figure 1, Areas from which workers arrived into Christchurch Central, 2023 Census
Compare commuter patterns over time
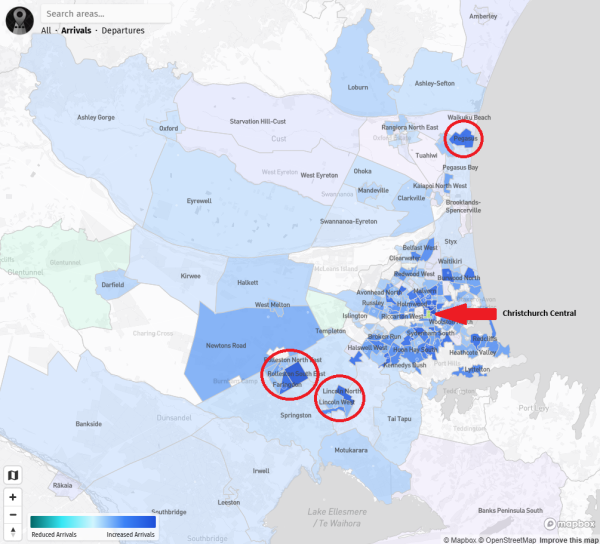
The comparison tab shows how commuter patterns changed between the 2018 and 2023 Censuses. In 2023, there was a clear increase in the number of people commuting to Christchurch Central from places further away, such as Rolleston, Lincoln, and Pegasus (shown by the dark blue around these areas on the map).
Figure 2, Areas from which worker arrivals into Christchurch Central increased or reduced, 2018 and 2023 Censuses
Text alternative for figure 2, Areas from which worker arrivals into Christchurch Central increased or reduced, 2018 and 2023 Censuses
Filter by mode of transport
"You can filter commuter data by mode of transport in the updated Commuter Waka," Connolly said. "Now you can look at specific commuter flows, such as travel by train or bicycle."
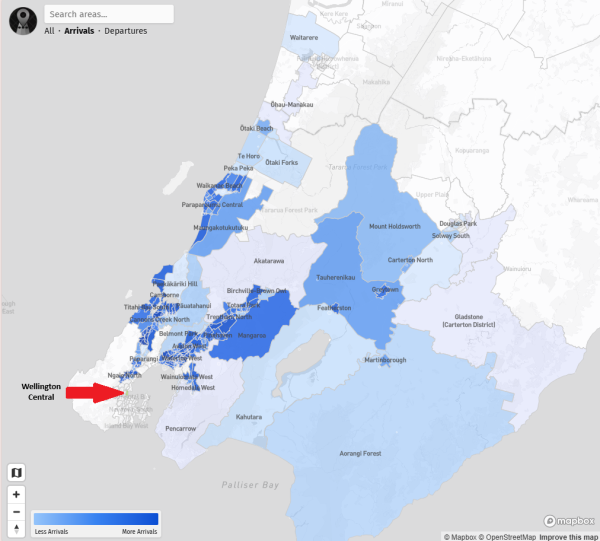
Of those who work in Wellington Central, 23 percent used trains as their main way of travelling to work in 2023. The clustering of dark blue areas on the map, showing travel to Wellington Central by train, highlights the areas serviced by train lines.
Figure 3, Areas from which workers arrived into Wellington Central, for those who travelled to work by train, 2023 Census
Text alternative for figure 3, Areas from which workers arrived into Wellington Central, for those who travelled to work by train, 2023 Census
Text alternative for figure 1, Areas from which workers arrived into Christchurch Central, 2023 Census
Image of a map of Christchurch and surrounds that shows the areas from which workers arrived into Christchurch Central in 2023. It uses a scale of shades of blue to show commuter patterns from fewer arrivals (pale blue) to more arrivals (dark blue).
Text alternative for figure 2, Areas from which worker arrivals into Christchurch Central increased or reduced, 2018 and 2023 Censuses
Image of a map of Christchurch and surrounds that shows the areas from which worker arrivals into Christchurch Central increased or reduced between the 2018 and 2023 Censuses. The map uses a scale in shades of turquoise and blue to show commuter patterns from fewer arrivals (dark turquoise) to more arrivals (dark blue).
Text alternative for figure 3, Areas from which workers arrived into Wellington Central, for those who travelled to work by train, 2023 Census
Image of a map of Wellington and surrounds showing the areas from which workers arrived into Wellington Central by train in 2023. It uses a scale in shades of blue to show commuter patterns from fewer arrivals (pale blue) to more arrivals (dark blue).


