To better estimate flood risks, risk maps should also consider historical data. This is recommended by researchers of CEDIM - Center for Disaster Management and Risk Reduction Technology of Karlsruhe Institute of Technology (KIT). CEDIM has now presented its first report on the flood disaster in Rhineland-Palatinate and North Rhine-Westphalia. As regards the role of climate change, the combination of more water available in the atmosphere and increasing permanence of general weather situations is associated with an increasing probability of extreme precipitation events.
Last week's flood disaster in Germany caused more than 170 deaths (status: July 21, 2021). Still, quite a few people are missing. Damage to buildings and infrastructure facilities can be estimated roughly only. It will amount to double-digit billions, including at least 2 billion euros for the transport infrastructures. Meanwhile, the German Insurance Association has estimated the insured loss to range from four to five billion euros in Rhineland-Palatinate and North Rhine-Westphalia only. How did it come to the floods that mainly hit Rhineland-Palatinate and North Rhine-Westphalia? How can flood risks - in particular rare and extreme events - be better estimated in advance? These questions were studied by the Forensic Disaster Analysis (FDA) Group of CEDIM that presented a first report.
The researchers explain that enormous precipitation volumes caused the Ahr river level (at Altenahr) to clearly exceed it previous record of 2016 (3.71 m, flow rate: 236 m3/s). As a result of the flood, the measurement station, however, broke down at a water level of 5.05 m (flow rate: 332 m3/s). From model calculations, the Rhineland-Palatinate State Agency for the Environment calculated a river level of up to seven meters in the night of the disaster. On this basis, experts estimated a flow rate that ranged between 400 and 700 m3/s.
Several Factors Caused the Extremely High Precipitation
From the meteorological perspective, several factors caused the extremely high precipitation. "Within 48 hours, rainfall quantities in parts of North Rhine-Westphalia and Rhineland-Palatinate exceeded the total precipitation volume usually encountered in the month of July. Most of the precipitation even fell within about ten hours only," CEDIM Spokesperson Professor Michael Kunz reports. In addition, the structured terrain of the regions affected, in particular in the district of Ahrweiler, with its deep river valleys increased surface flow. This situation was aggravated by the fact that the soil had already been saturated by high precipitation volumes on the previous days.
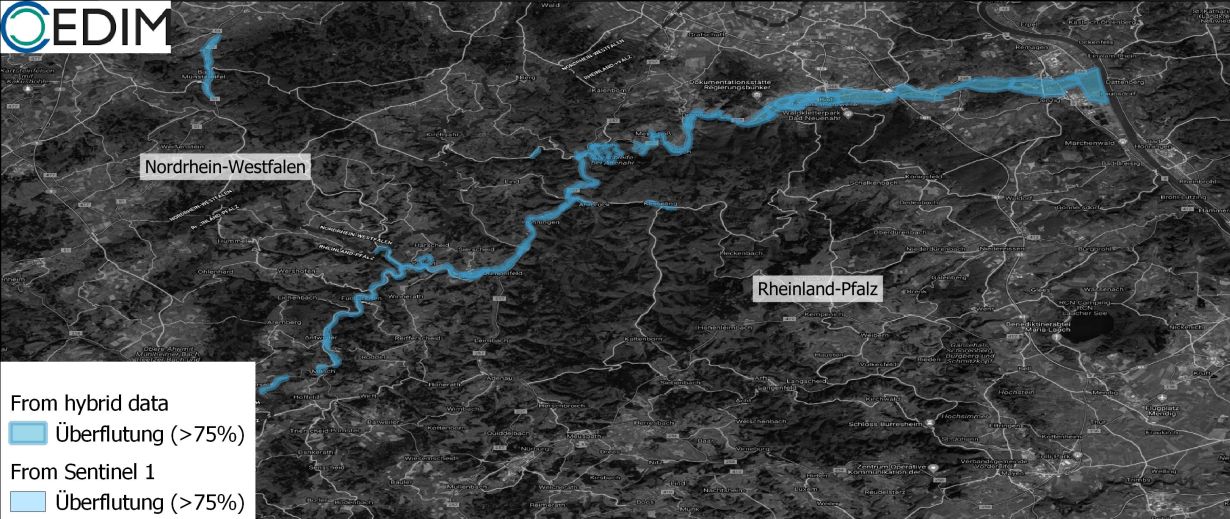
To estimate the flooded areas in the most severely hit districts of Ahrweiler and Rhein-Erft, the research team combined satellite data with aerial photos of (amateur) drones and helicopters and photos published in social media. According to estimates, about 19,000 buildings having a total value of about nine billion euros are located in the flooded areas. Using empirical data of past flood disasters (infrastructure damage, damage due to natural hazards, and other damage), the researchers estimated the total damage to range between 11 and 24 billion euros (first CEDIM estimate: July 21, 2021). However, it must be considered that the flooded areas represent part of the total area affected only.
More Water in the Atmosphere and Increasing Permanence of General Weather Situations Make the Risk Grow
According to KIT's researchers, it is impossible to exactly confirm or completely deny that a single extreme event or the sequence of several extremes is caused by climate change, in particular when these events take place on short temporal and spatial scales that are strongly influenced by local factors. As regards large-scale processes in the atmosphere leading to extreme events, however, it can be stated that more water in the atmosphere due to the increasing temperature combined with an increasing permanence of general weather situations with a jet stream that tends to shift north results in a high risk potential. "As these three factors are expected to follow positive trends in future, the probability of extreme precipitation events will increase," Kunz explains.
Great Floods in the Ahr Valley in 1804 and 1910
"In 1804 and 1910, two great floods occurred in the Ahr valley. Comparison of current data with historical recordings leads to the assumption that this year's values are smaller than those of 1804," says Deputy CEDIM Spokesperson Dr. James Daniell. For the flood of 1804, the flow rate was estimated to about 1100 m3/s by Bonn University. From the hydrological point of view, this year's flood might have had dimensions similar to that of 1910 with a flow rate of 500 m3/s. "Current flood maps for the Ahr valley are based on flow data measured after 1947. Since then, homogeneous measurement series have been available. Both historical events are not considered when estimating the risk," Dr. Andreas Schäfer, first author of the report, says. The reference flow rate used for flood protection measures on the Ahr river presently amounts to 241 m3/s.
The FDA Group of CEDIM urgently recommends to consider historical data, also from the time before the start of continuous measurements, when generating flood risk maps. This will allow for a better estimation of flood risks, they say. "When analyzing and interpreting the data, however, it must be noted that both infrastructures and flood protection measures changed in the past years. Measurements can hardly be compared directly and we should not so much focus on water levels," Daniell says. "The water levels of 1804 and 1910 might be used as indirect indicators to identify flood years. Flow rates measured as a function of time and precipitation are more important to interpretation. In the end, both historical parameters - water level and flow rate - should be considered when setting up risk maps." (or)
Original Publication
Andreas Schäfer, Bernhard Mühr, James Daniell, Uwe Ehret, Florian Ehmele, Katharina Küpfer, Johannes Brand, Christina Wisotzky, Jens Skapski, Lukas Renz, Susanna Mohr, Michael Kunz: Hochwasser Mitteleuropa, Juli 2021 (Deutschland). Report No. 1 "Nordrhein-Westfalen & Rheinland-Pfalz". CEDIM Forensic Disaster Analysis (FDA) Group. KIT, 2021. DOI: 10.5445/IR/1000135730
https://www.cedim.kit.edu/download/FDA_HochwasserJuli2021_Bericht1.pdf


