From October to December 2024, global sea surface temperature (SST) anomalies generally remained above average. In the Pacific, all four Niño indices were near zero or slightly negative, indicating an overall ENSO-neutral SST state in the equatorial central and eastern Pacific. Meanwhile, the Indian Ocean Dipole (IOD) anomaly was below average. In the tropical Atlantic, SST anomalies in both the North Tropical Atlantic (NTA) and South Tropical Atlantic (STA) were above zero, reflecting continuation of sustained widespread warmth across the region.
SST anomalies in the Niño 3.4 and Niño 3 regions are expected to decline slightly during February-April (FMA) 2025, with a small chance of entering weak La Niña territory. In the Niño 4 region farther west, SST anomalies are also predicted to decrease slightly. The Indian Ocean Dipole (IOD) index is projected to return to near-average levels. In the equatorial Atlantic, SSTs are forecast to remain positive in both the northern (NTA) and southern (STA) regions, with larger positive anomalies anticipated in the NTA.
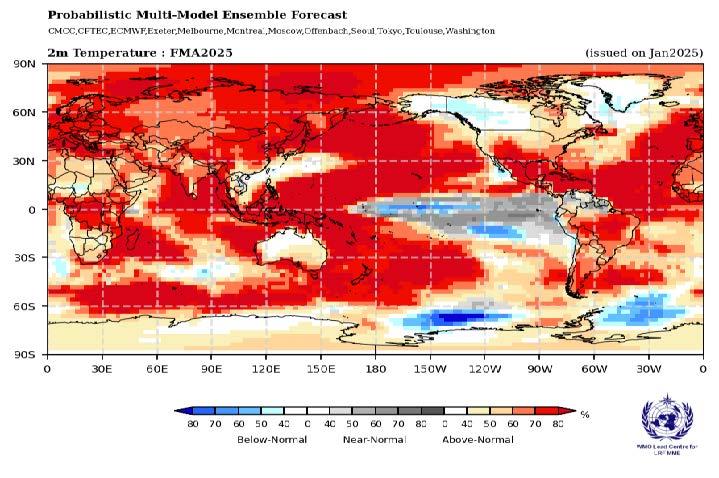
Building on the anticipated persistence of above-normal sea surface temperatures across most ocean basins outside the near-equatorial eastern Pacific Ocean, above-normal temperatures are predicted over most land areas for the FMA 2025 period. Exceptions to this widespread warmth include regions near the Bering Sea, the Gulf of Alaska, Baja California, and southwestern Greenland. Extensive areas with a high probability of above-normal temperatures include South America south of the equator; the Caribbean and Central America; southwestern North America; Europe; Africa between 10°S and 10°N, extending into the southern Arabian Peninsula; Northeastern India, extending into East Asia; the Maritime Continent; New Zealand; and the Arctic regions north of 60°N. Regions with moderate to weaker increases in probabilities for above-normal temperatures include Southeast Asia, northern and southern Africa, and southern Australia. In contrast, coastal areas of southern South America, extending north along the west coast to just north of the equator and into the eastern Pacific, are expected to experience below or near-normal temperatures, consistent with the predicted continuation of below- to near-average SSTs in the eastern Pacific. There is no clear temperature signal over northern Greenland, northern Australia, and parts of northwestern North America.
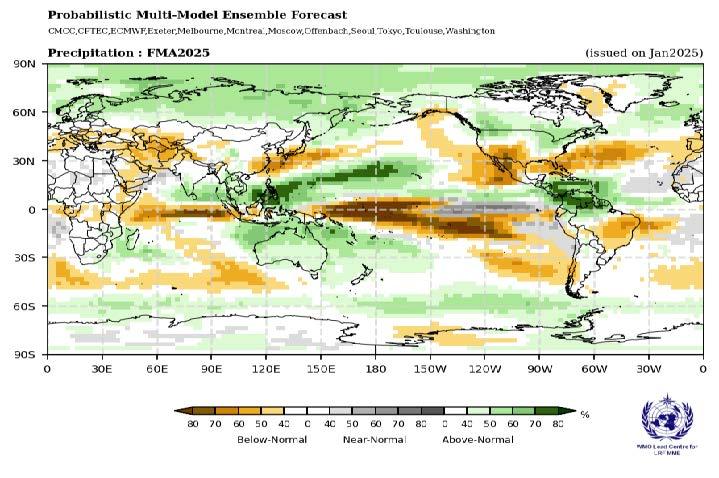
Although sea surface temperatures in the central and eastern Pacific are predicted to be slightly below average, the enhanced east-to-west SST gradient in the equatorial Pacific - similar to a La Niña pattern - suggests rainfall patterns for FMA 2025 will reflect typical La Niña impacts. Regions with enhanced probabilities for below-normal rainfall include a narrow band along or just north and south of the equator, extending eastward from 140°E to the western coast of South America; a band south of the equator, starting from 150°W and extending south-eastward to the western coast of South America below 30°S; northeastern South America, extending into the Atlantic; areas of North America south of 30°N; southern Europe; the Arabian Peninsula, extending north-eastward into Central Asia; parts of eastern Asia; the Greater Horn of Africa, extending into the Indian Ocean and the western Maritime Continent. Regions with enhanced probabilities for above-normal rainfall include the eastern Maritime Continent, extending southward to Australia and further into the western Pacific to 150°W; southern parts of Central America and the Caribbean; Arctic regions north of 60°N; southern parts of the Indian subcontinent; a belt along 60°S in the Southern Hemisphere; a band off the eastern coast of Asia near 40°N, extending north-eastward to the Bering Sea and the Gulf of Alaska; and areas between 40°N and 60°N over North America. There is no clear rainfall signal over most of Africa, Central Asia, and some other regions.


