4 min read
As students head back to school, teachers have a new tool that brings NASA satellite data down to their earthly classrooms.

For over 50 years of observing Earth, NASA's satellites have collected petabytes of global science data (that's millions and millions of gigabytes) - with terabytes more coming in by the day. Since 2004, the My NASA Data website has been developing ways for students and teachers of grades 3-12 to understand, and visualize NASA data, and to help incorporate those measurements into practical science lessons.
"We have three different types of lesson plans, some of which are student-facing and some are teacher-facing," said Angie Rizzi, My NASA Data task lead, based at NASA's Langley Research Center in Hampton, Virginia. "Teachers can download complete lesson plans or display a wide variety of Earth data. There are also lessons written for students to interact with directly."
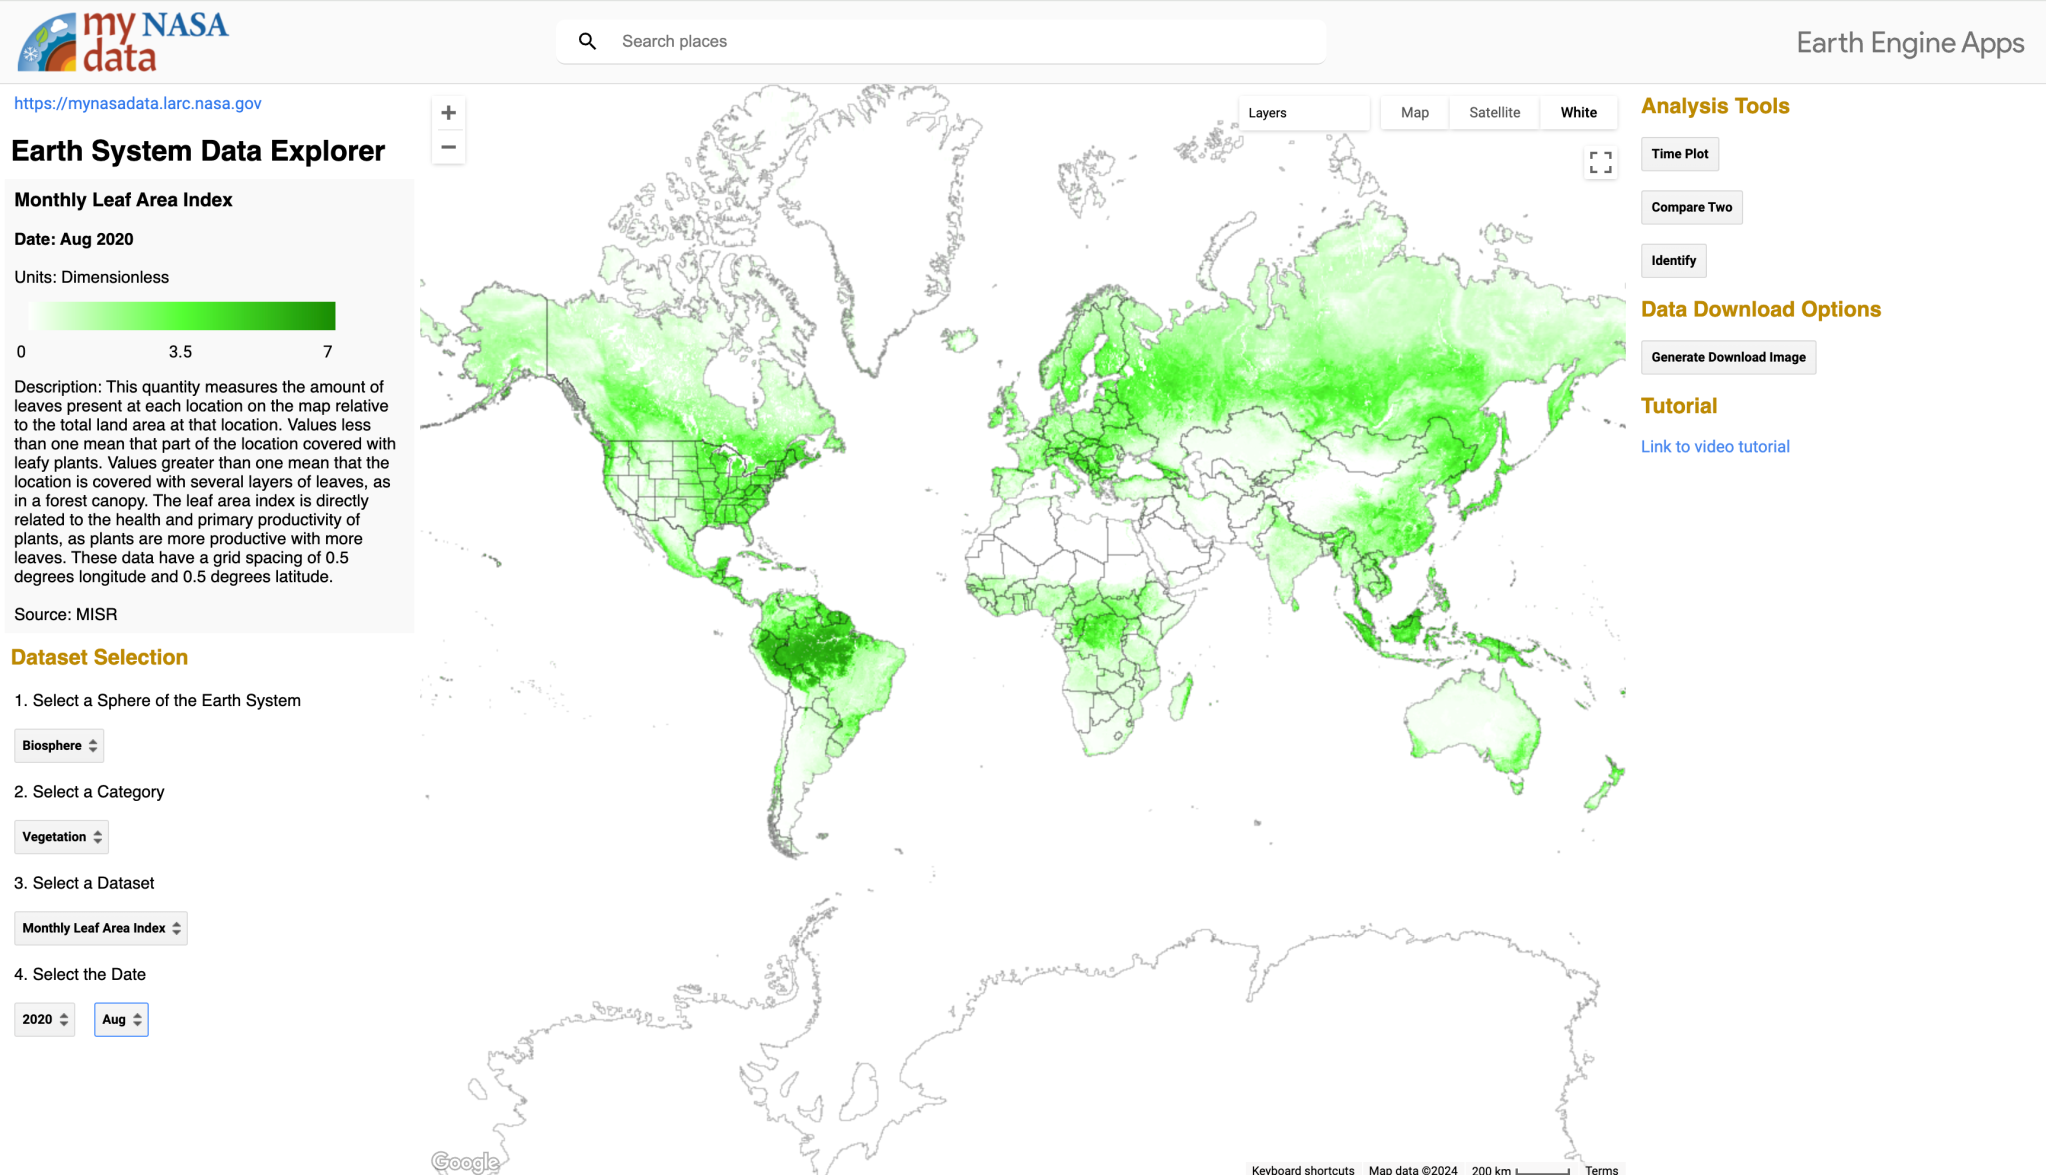
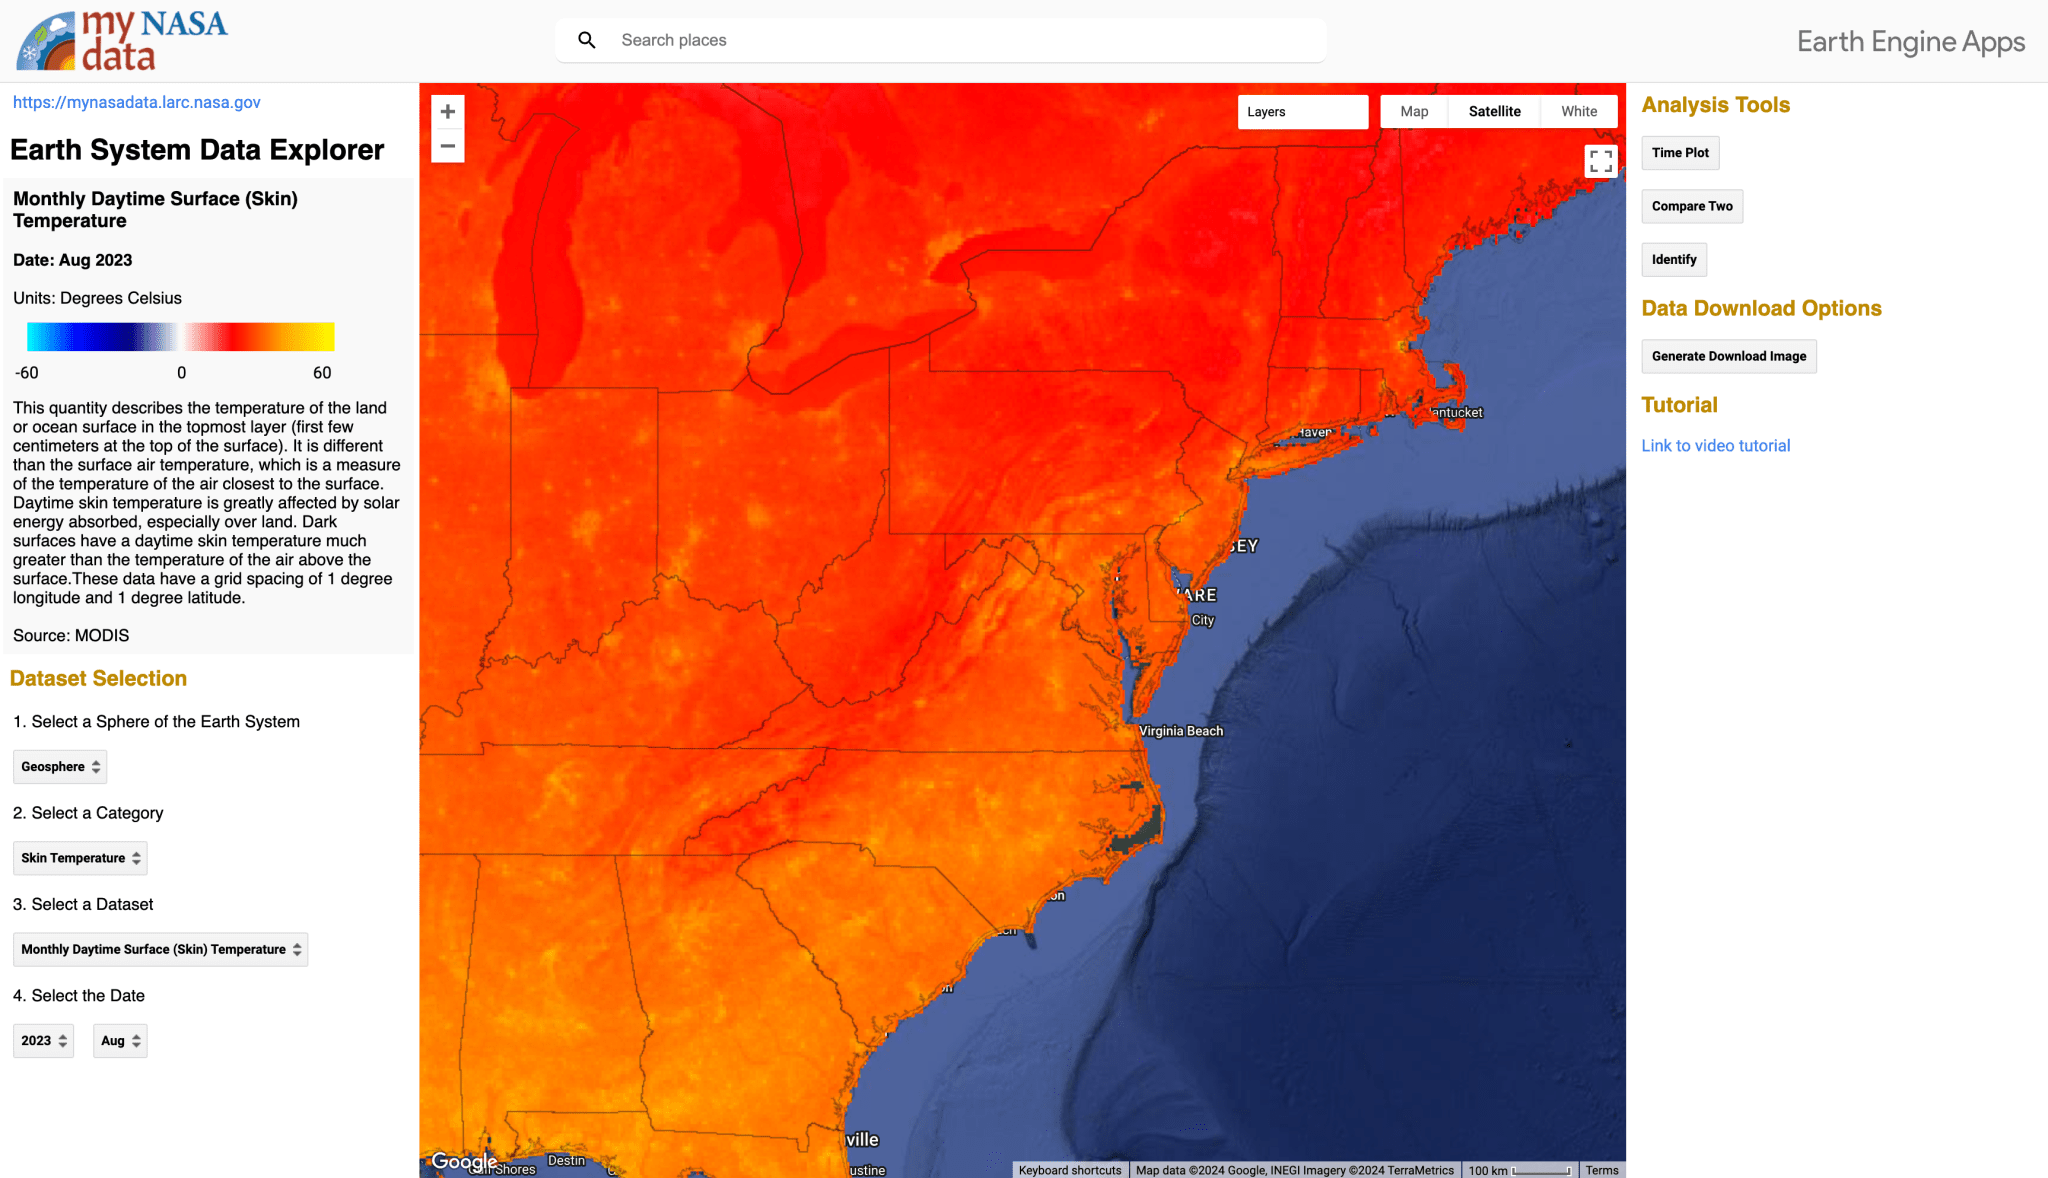
A key component of the My NASA Data site is the newly updated Earth System Data Explorer visualization tool, which allows users to access and download NASA Earth data. Educators can explore the data then create custom data tables, graphs, and plots to help students visualize the data. Students can create and investigate comparisons between land surface temperatures, cloud cover, extreme heat, and a wide range of other characteristics for a specific location or region around the globe.
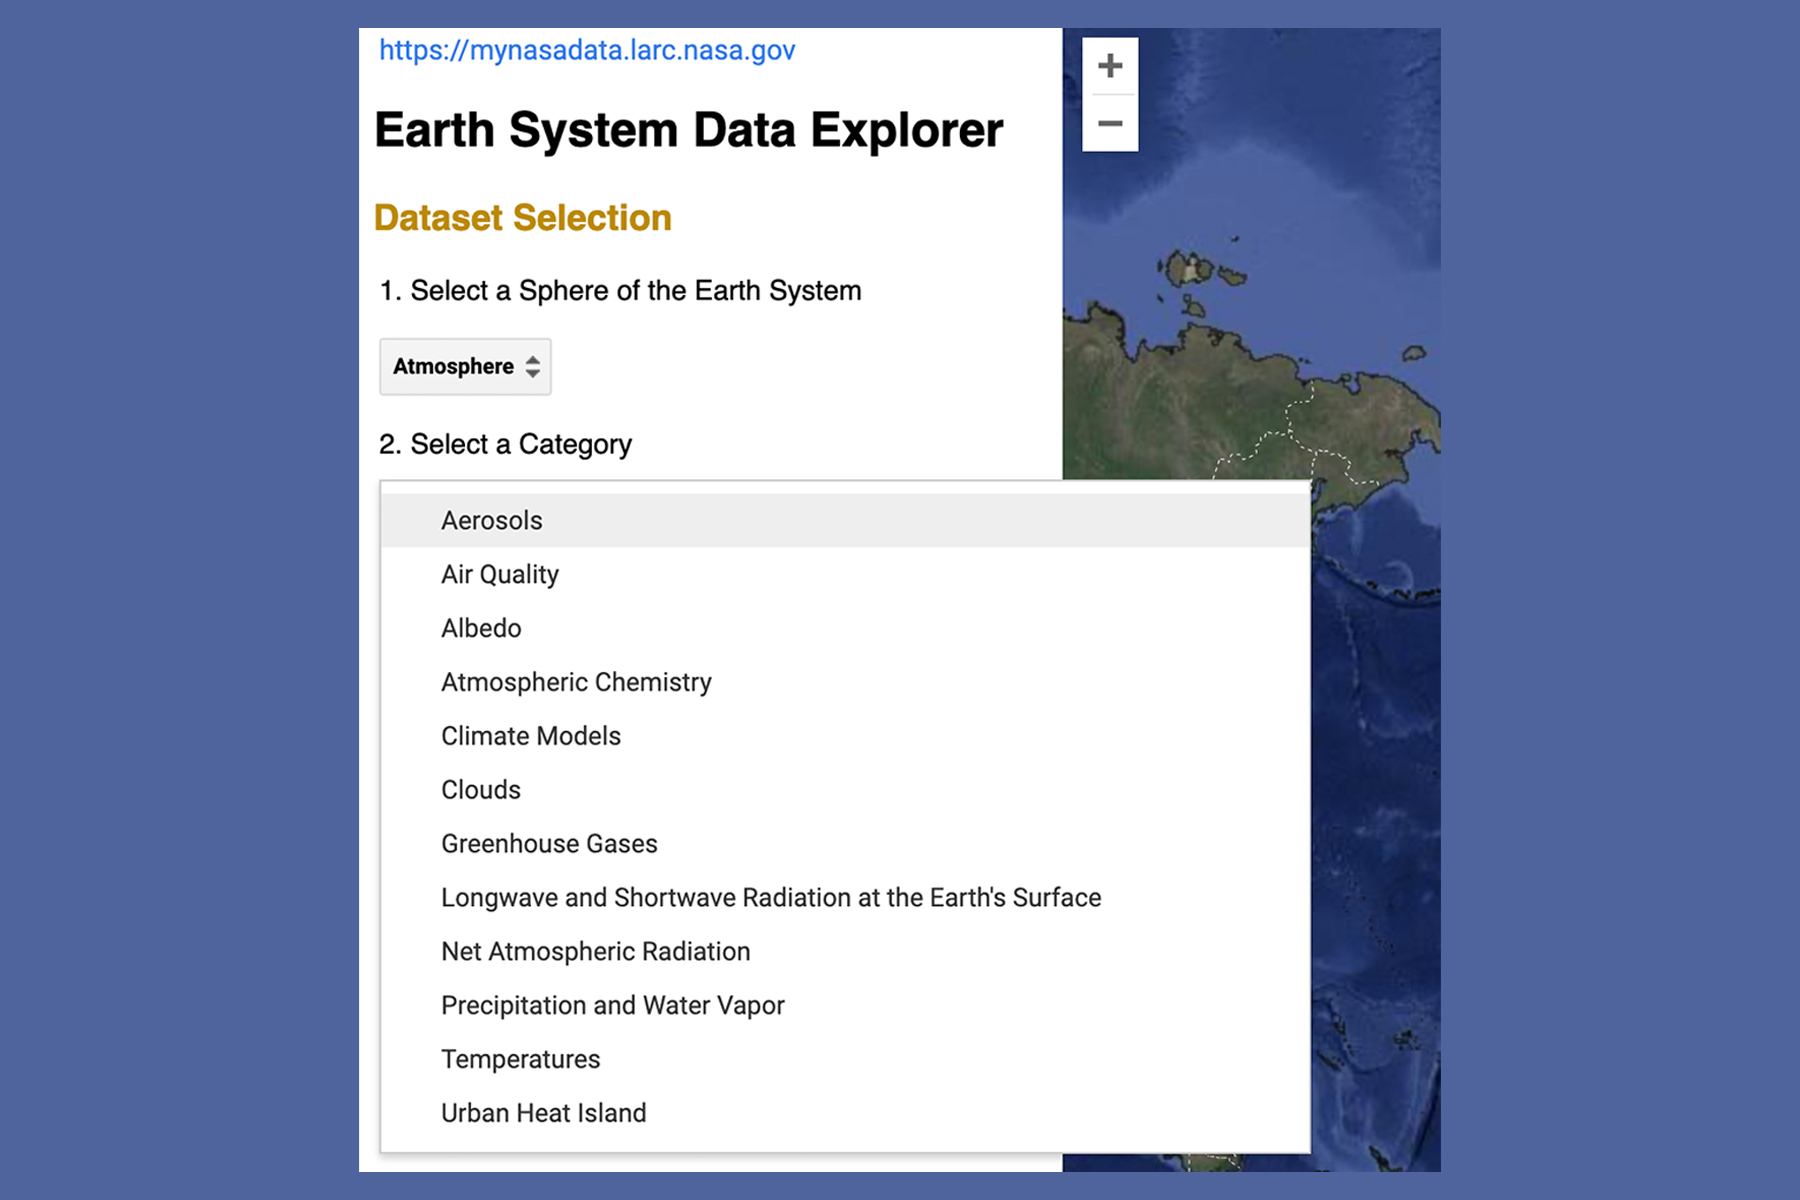
"The Earth System Data Explorer tool has a collection of science datasets organized by different spheres of the Earth system," explained Desiray Wilson, My NASA Data scientific programmer. The program highlights six areas of study: atmosphere, biosphere, cryosphere, geosphere, hydrosphere, and Earth as a system. "The data goes as far back as the 1980s, and we are getting more daily datasets. It's really good for looking at historical trends, regional trends, and patterns."
My NASA Data had over one million site visits last year, with some of the most popular searches focusing on temperatures, precipitation, water vapor, and air quality.
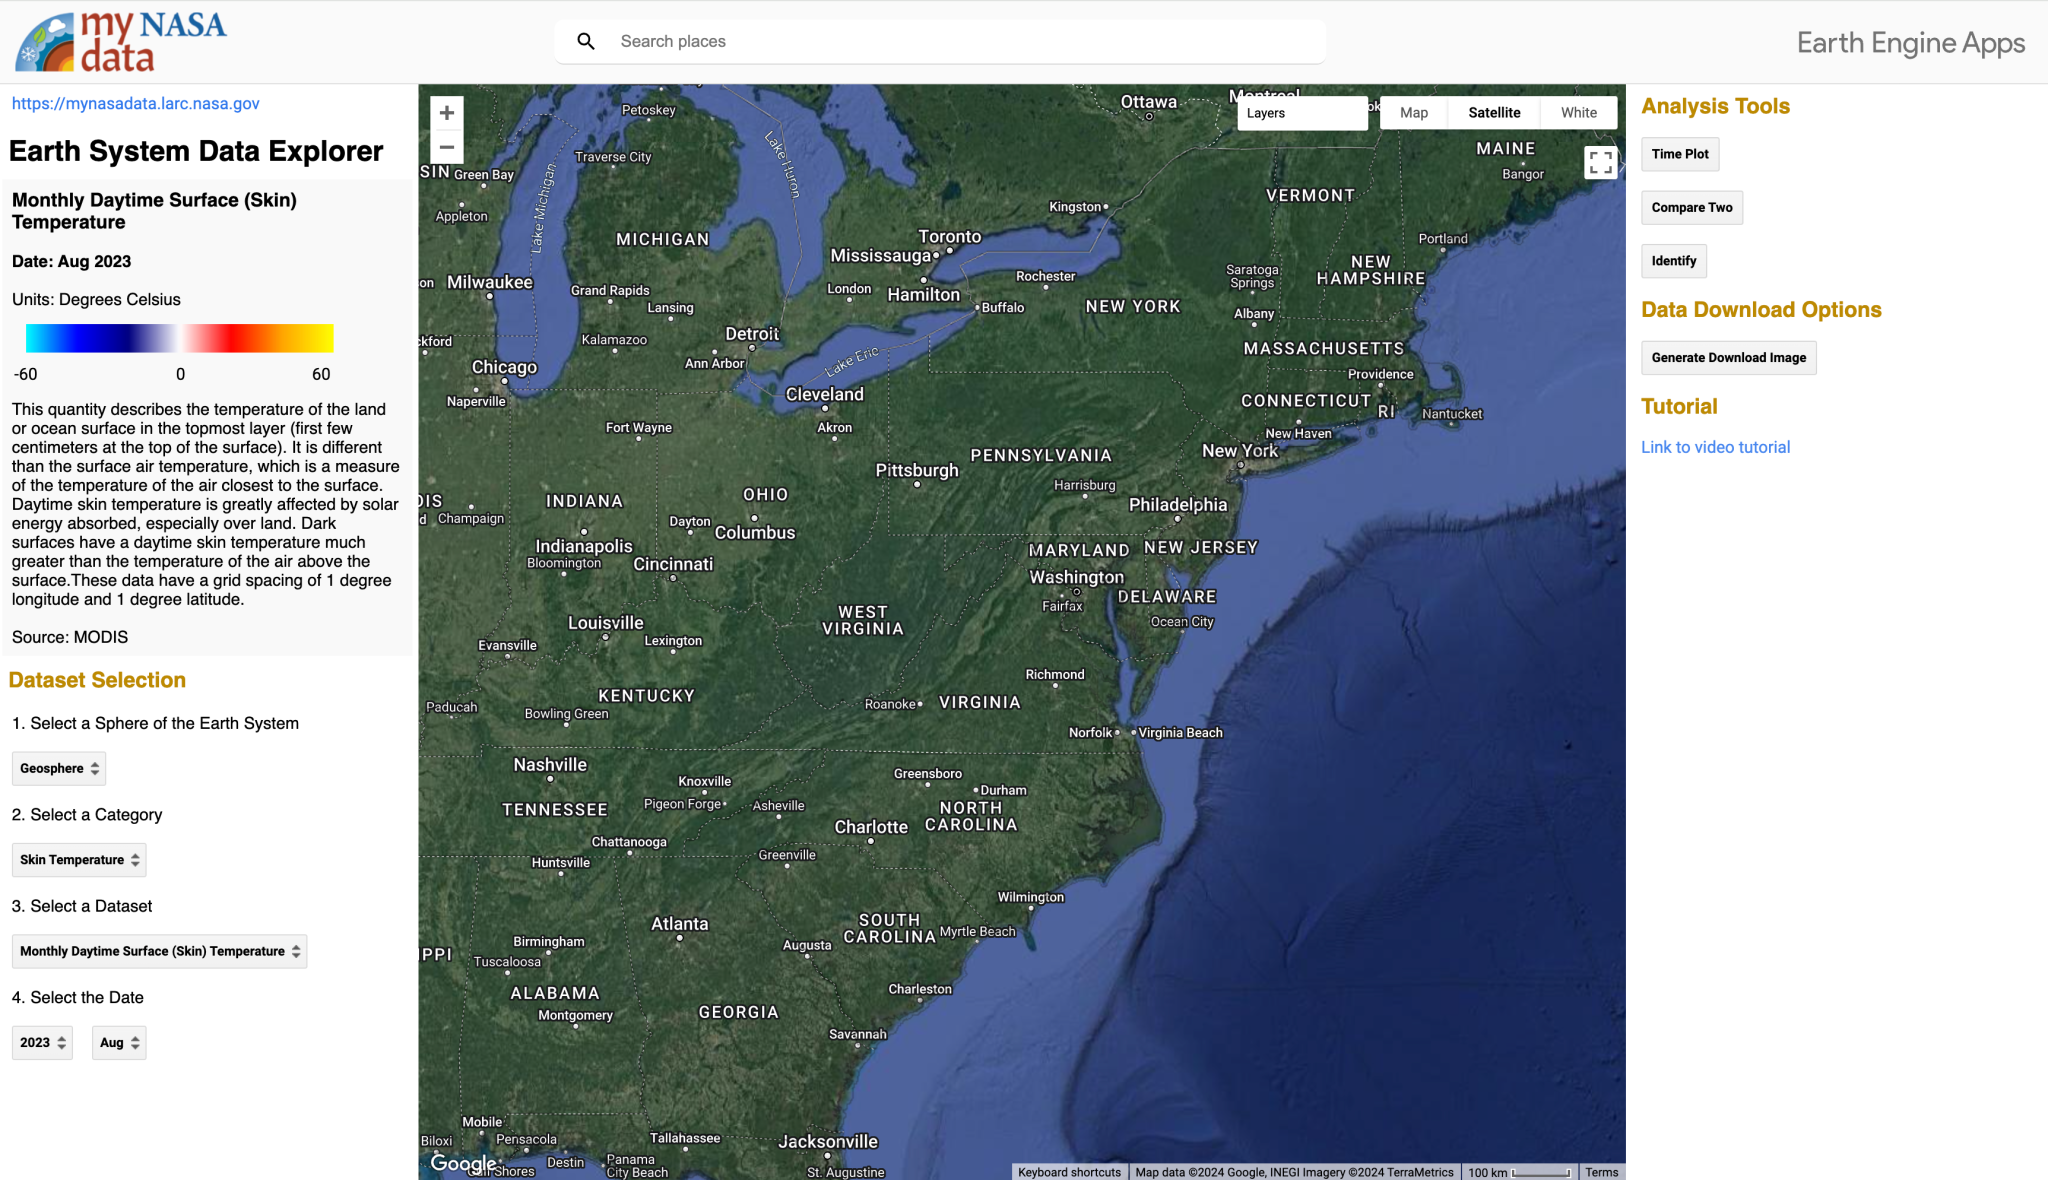
Natalie Macke has been teaching for 20 years and is a science teacher at Pascack Hills High School in Montvale, New Jersey. Teachers like Macke help shape the lessons on the site through internships with the My NASA Data team. Teachers' suggestions were also incorporated to enhance the visualization tool by adding new features that now allow users to swipe between visual layers of data and make side-by-side comparisons. Users can also now click on a location to display latitude and longitude and variable data streamlining the previous site which required manual input of latitude and longitude.
"The new visualization tool is very much a point-and-click layout like our students are used to in terms of just quickly selecting data they want to see," said Macke. "Instantaneously, a map of the Earth comes up, or just the outline, and they can get the satellite view. So if they're looking for a specific city, they can find the city on the map and quickly grab a dataset or multiple datasets and overlay it on the map to make visual comparisons."
Even more valuable than creating visualizations for one specific lesson, elaborated Macke, is the opportunity My NASA Data provides for students to understand the importance of interpreting, verifying, and using datasets in their daily lives. This skill, she said, is invaluable, because it helps spread data literacy enabling users to look at data with a discriminating eye and learn to discern between assumptions and valid conclusions.
"Students can relate the data map to literally what's happening outside their window, showing them how NASA Earth system satellite data relates to real life," said Macke. "Creating a data literate public - meaning they understand the context and framework of the data they are working with and realizing the connection between the data and the real world - hopefully will intrigue them to continue to explore and learn about the Earth and start asking questions. That's what got me into science when I was a little kid."


