International trade statistics provide information on imports and exports of goods and services between New Zealand and our trading partners.
Correction to overseas trade index (OTI) terms of trade, import prices, and import volumes for June 2024 quarter
In this release we have corrected the June 2024 quarter OTI terms of trade and selected price and volume indexes in Infoshare and the 'Overseas trade indexes: September 2024 quarter (provisional) - prices and volumes' Excel tables, to correct an error in data processing.
Infoshare changes by date has further information about this correction.
Key facts
Quarterly goods and services
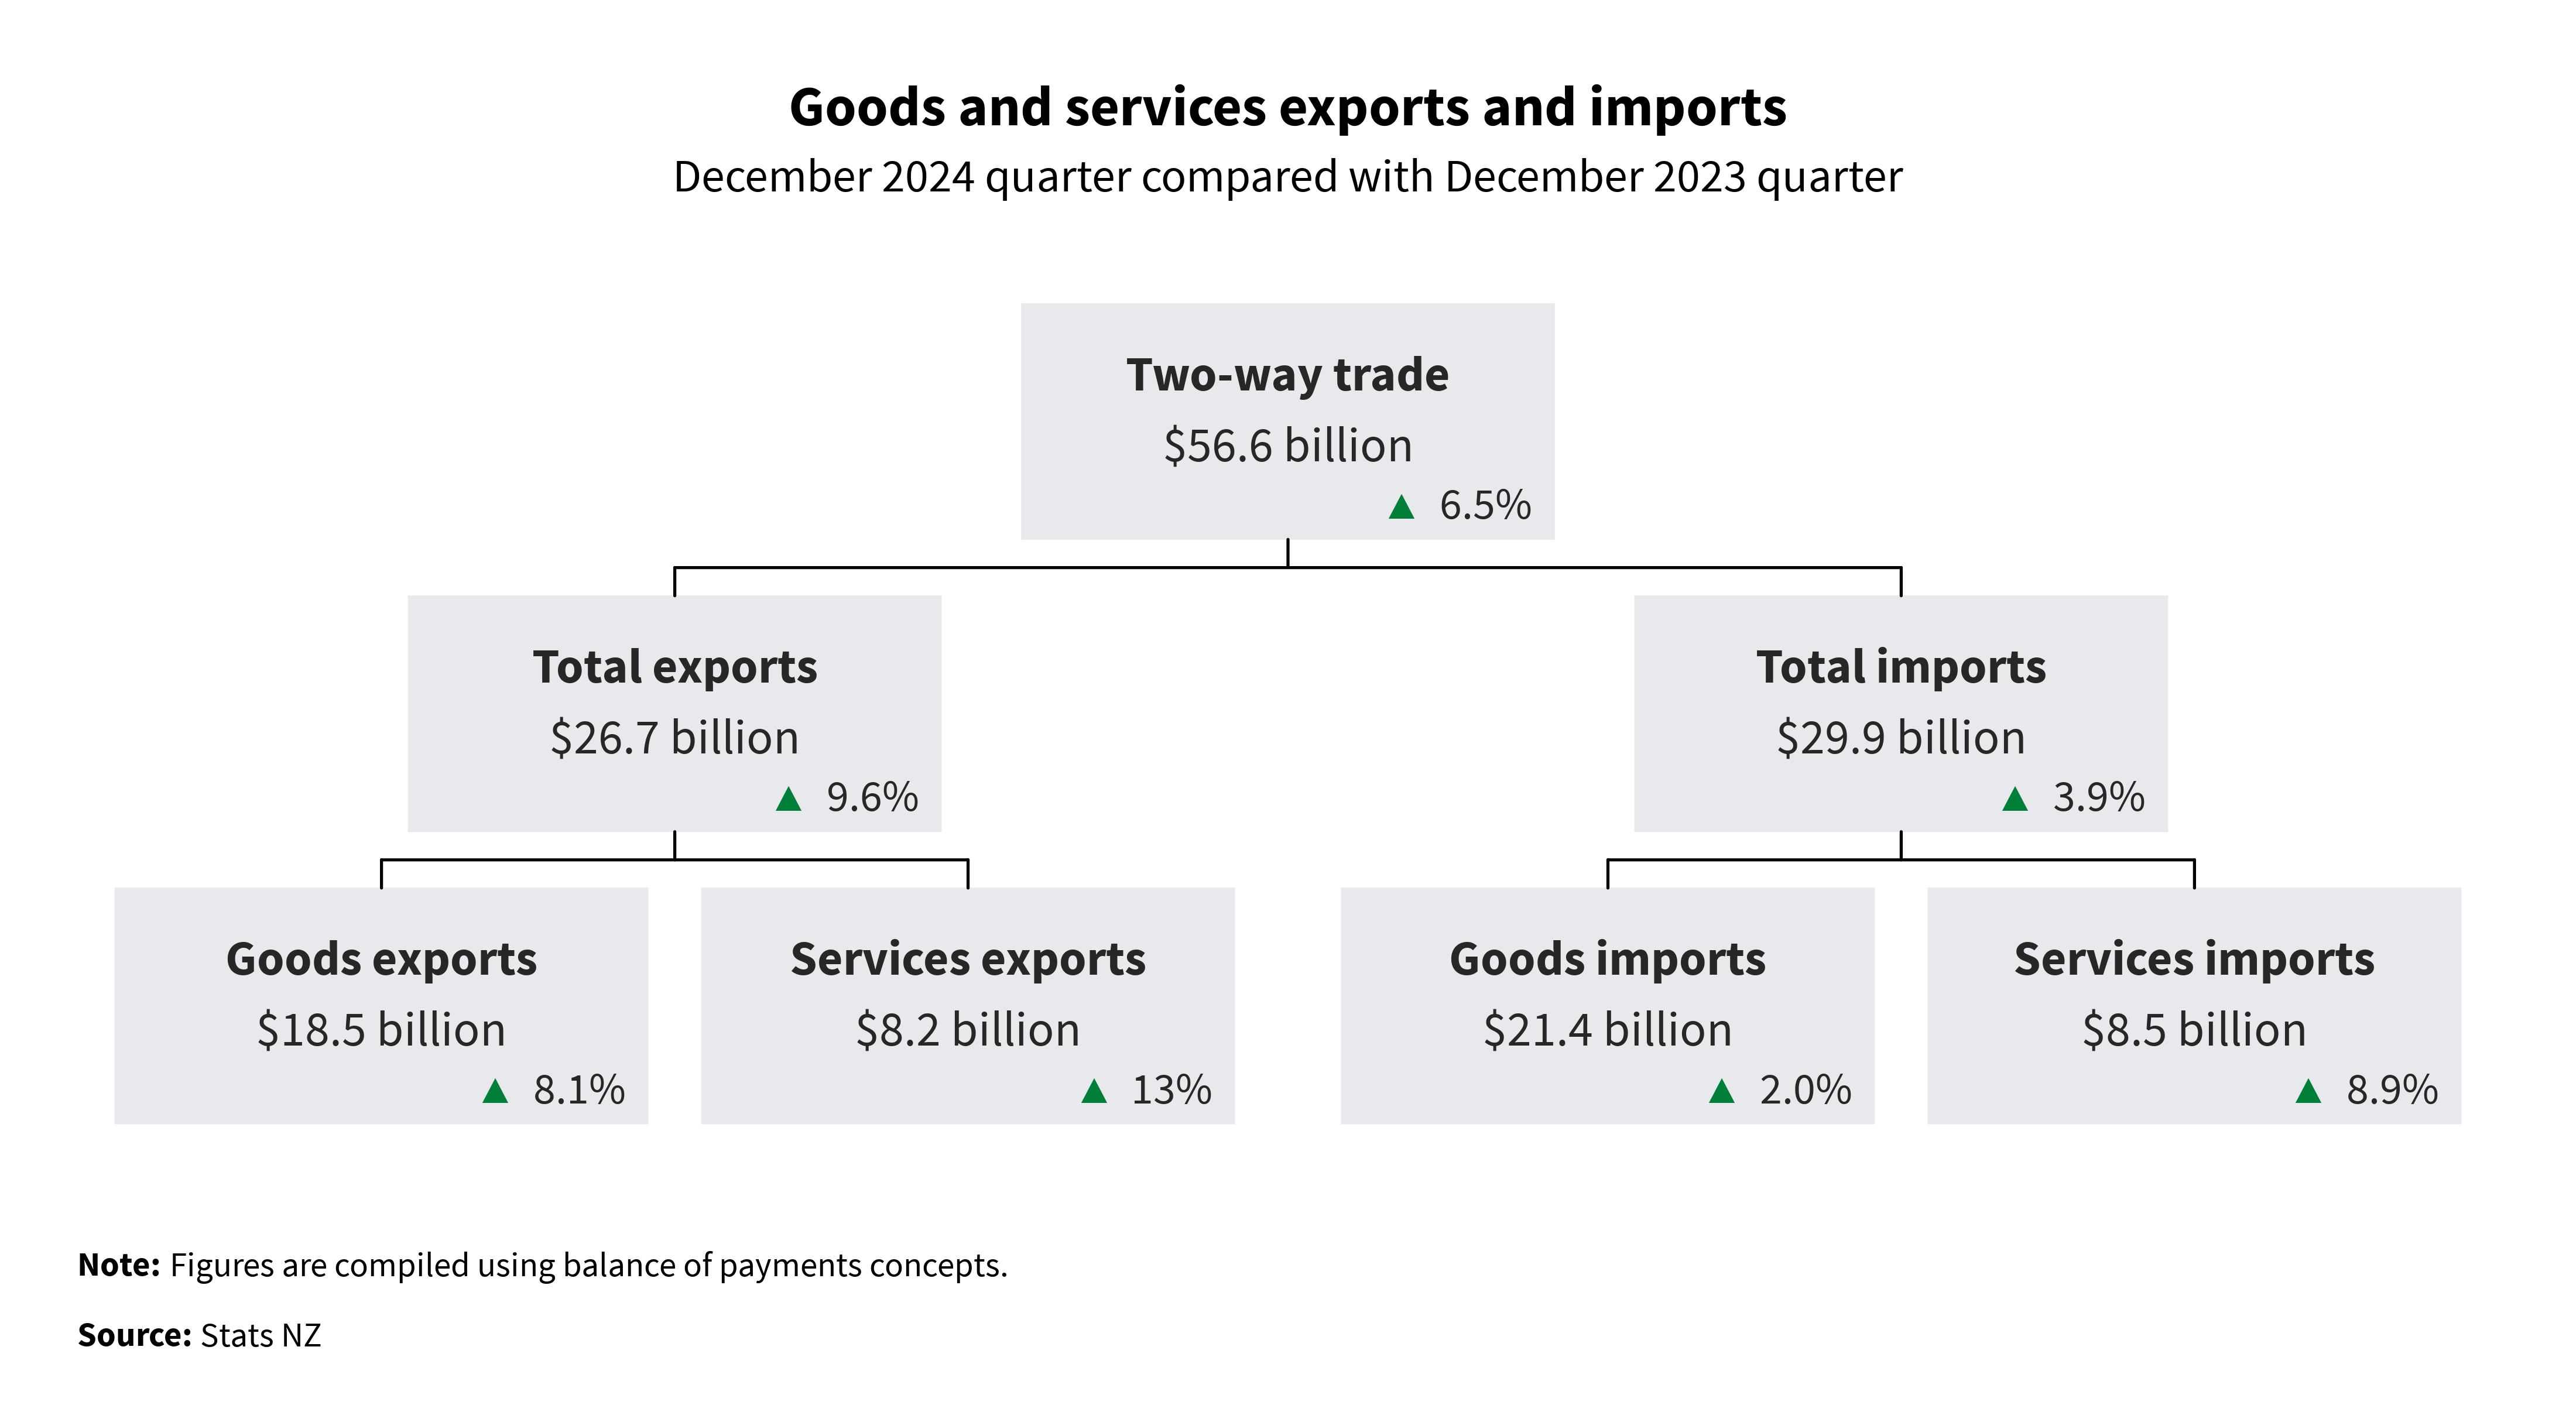
- Total exports of goods and services for the December 2024 quarter were $26.7 billion, up from $24.3 billion in the December 2023 quarter.
- Total imports of goods and services for the December 2024 quarter were $29.9 billion, up from $28.8 billion in the December 2023 quarter.
- The total two-way trade for the December 2024 quarter was $56.6 billion.
New Zealand international trade dashboard shows quarterly exports and imports data for goods and services by country and commodity type.
Total services exports rose $957 million to $8.2 billion in the December 2024 quarter compared with the December 2023 quarter.
The top movements of our services export categories were:
- travel services, up $674 million to $4.1 billion
- other business services, up $255 million to $1.0 billion
- transportation services, up $57 million to $1.1 billion
- telecommunication services, up $38 million to $536 million
- charges for the use of intellectual property, up $19 million to $469 million.
Total service imports rose $694 million to $8.5 billion in the December 2024 quarter compared with the December 2023 quarter.
The top movements of services import categories were:
- telecommunication services, up $195 million to $1.2 billion
- other business services, up $175 million to $1.6 billion
- travel services, up $162 million to $1.9 billion
- personal, cultural, and recreational services, up $61 million to $375 million
- financial services, up $42 million to $214 million.
Overseas trade indexes (OTI)
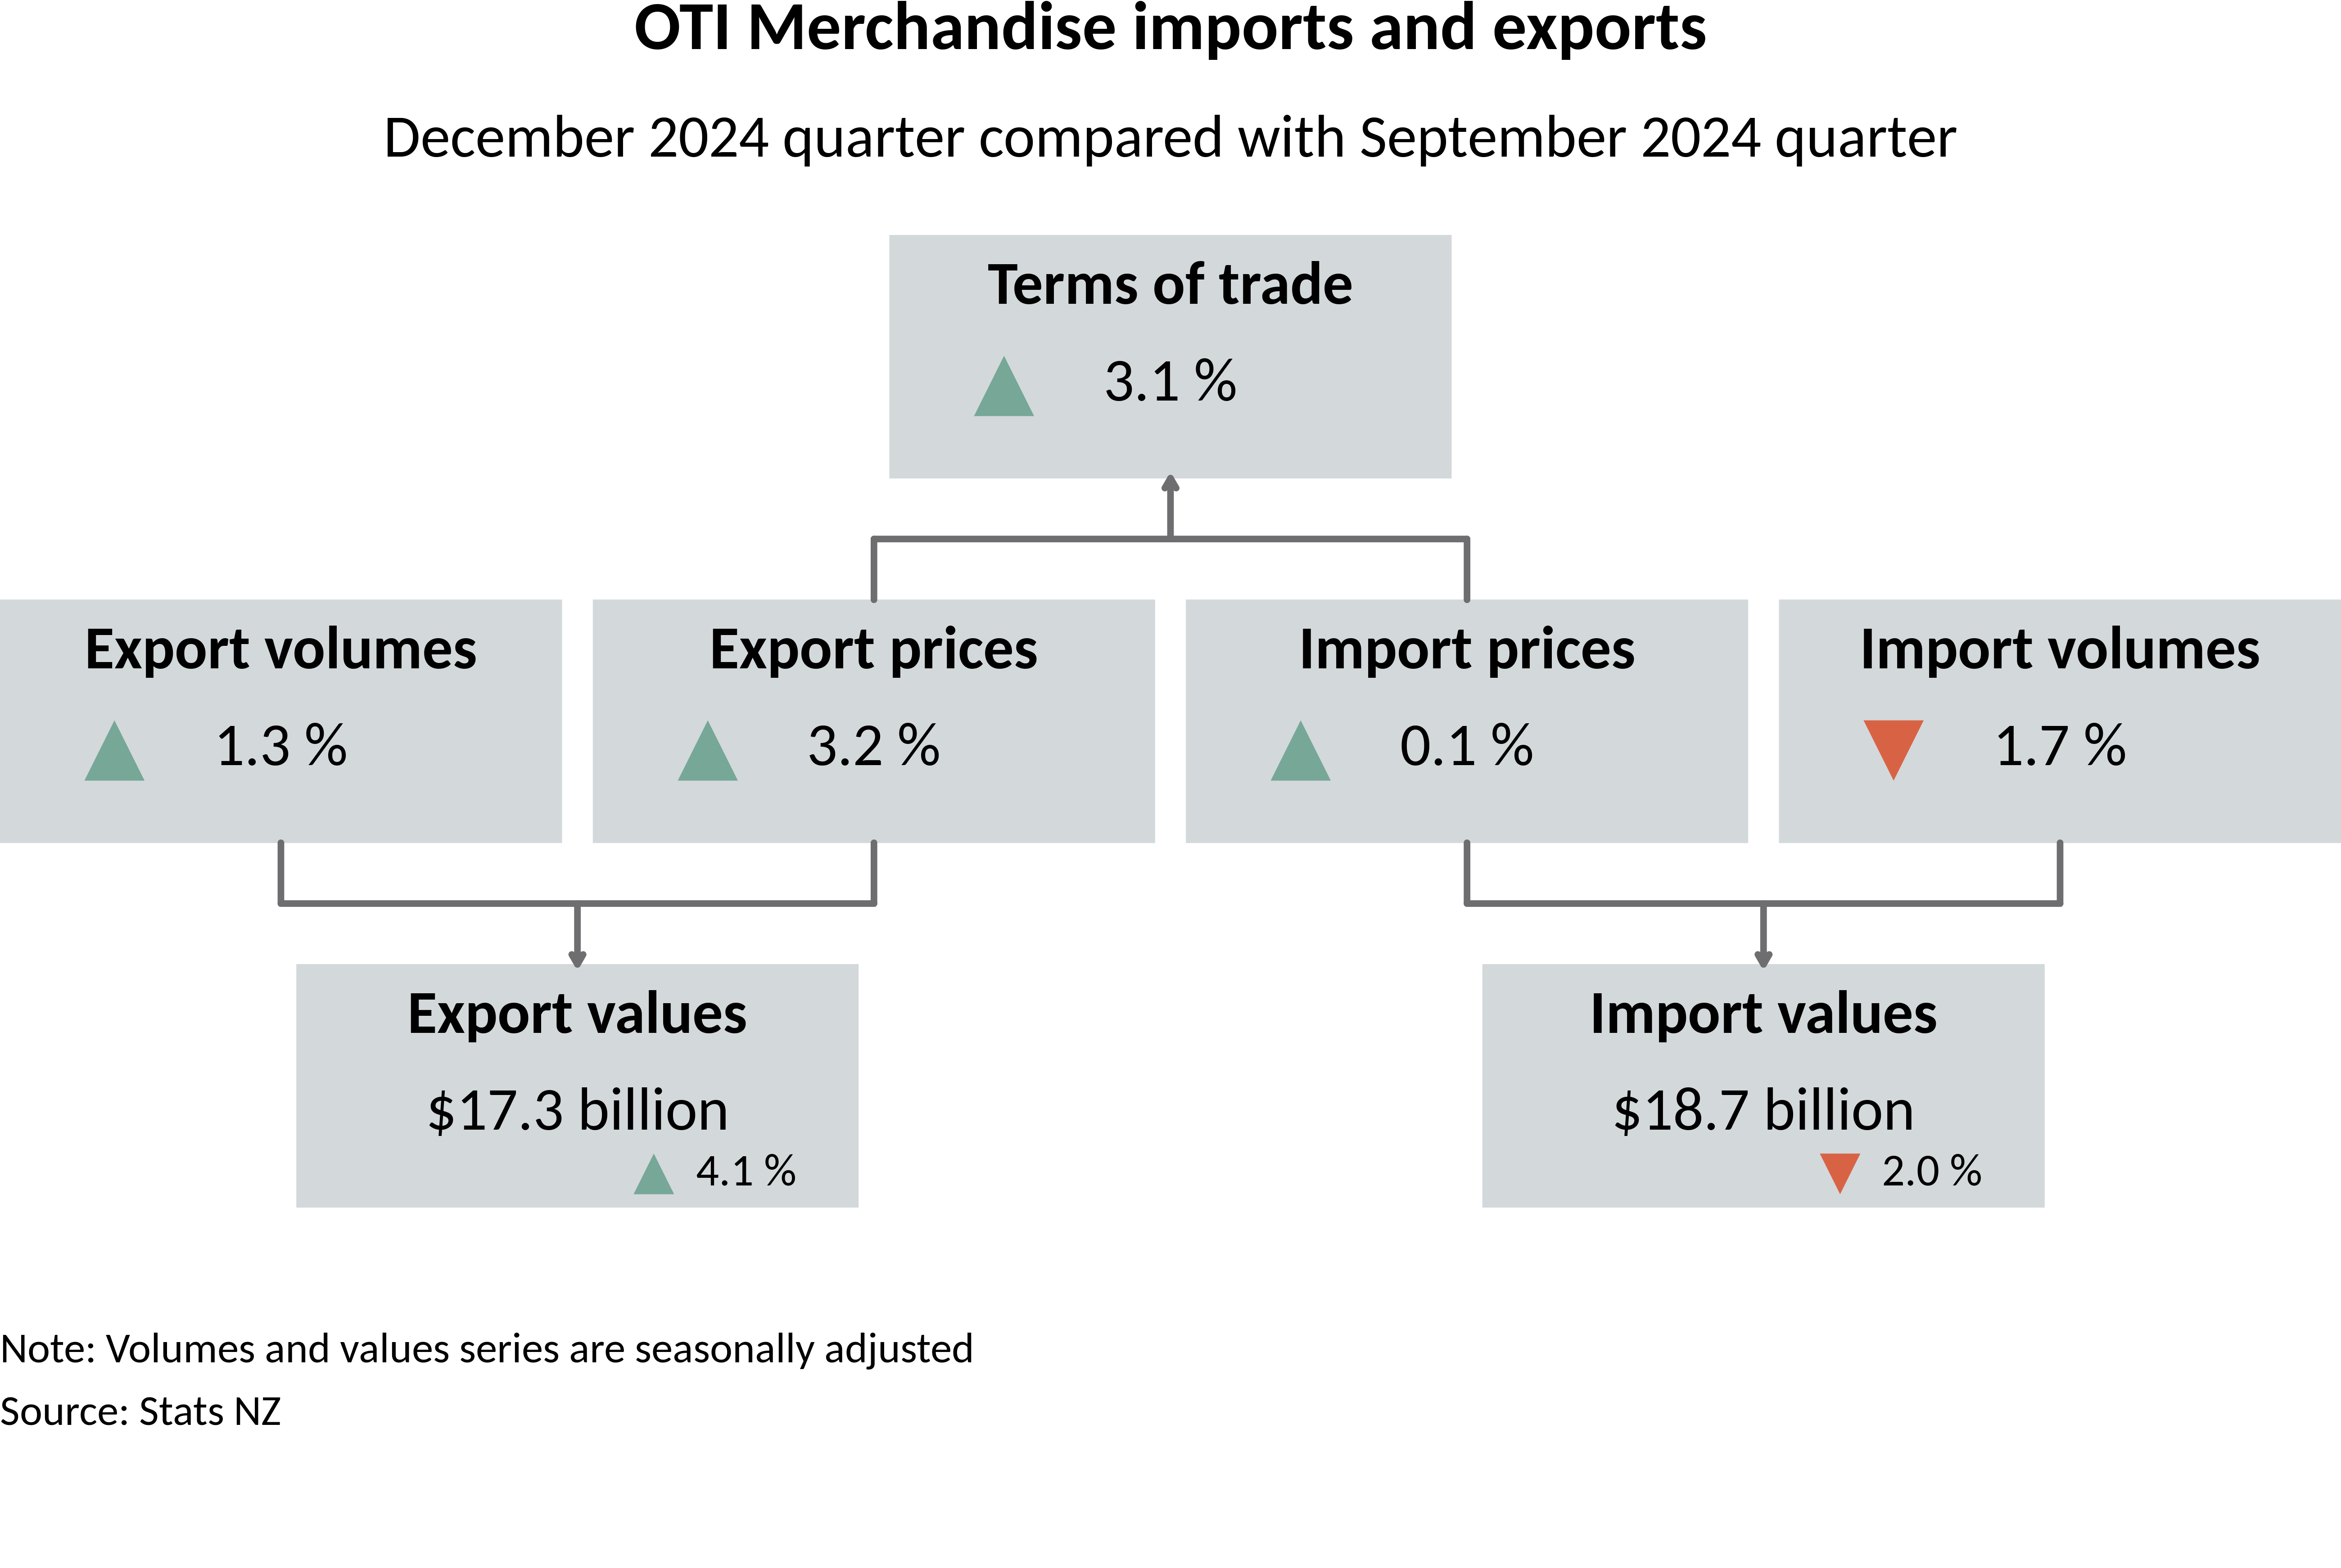
Movements are compared with the September 2024 quarter. All prices are unadjusted; all volumes and values are seasonally adjusted unless otherwise stated.
- The merchandise (goods) terms of trade rose 3.1 percent.
- Export prices for goods rose 3.2 percent and import prices rose 0.1 percent.
- Export volumes for goods rose 1.3 percent and import volumes fell 1.7 percent.
- Export values for goods rose 4.1 percent and import values fell 2.0 percent.
- The services terms of trade fell 1.7 percent.
- Services export prices rose 2.8 percent, while import prices rose 4.5 percent.
International Trade in Services & Royalties Survey (ITSS) data quality update
In the December 2024 quarter, the overall response rate was 79 percent, below the target response rate of 80 percent. The response rate for key firms was 89 percent, below the target response rate of 100 percent.
Declining response rates resulted in a higher level of imputation. We conducted additional quality assessment checks for any bias in the non-responding units to ensure our imputation model still holds. We found no concerns and ITSS data remained fit for purpose.
Late responses will be processed and revised for next quarter.
Text alternative for Goods and services exports and imports, December 2024 quarter compared with December 2023 quarter
The diagram shows two-way trade was up 6.5 percent to $56.6 billion. On the left-hand side of the diagram, total exports were up 9.6 percent to $26.7 billion. Goods exports were up 8.1 percent to $18.5 billion, and services exports were up 13 percent to $8.2 billion. On the right-hand side of the diagram, total imports were up 3.9 percent to $29.9 billion. Goods imports were up 2.0 percent to $21.4 billion, and services imports were up 8.9 percent to $8.5 billion. Note: Figures are compiled using balance of payments concepts.
Text alternative for OTI merchandise imports and exports, December 2024 quarter compared with September 2024 quarter
Diagram shows the terms of trade rose 3.1 percent, where export prices rose 3.2 percent and import prices rose 0.1 percent. The value of exports rose 4.1 percent to $17.3 billion. Flowing into this were export volumes which rose 1.3 percent, and export prices which rose 3.2 percent. The value of imports fell 2.0 percent to $18.7 billion. Flowing into this were import volumes which fell 1.7 percent, and import prices which rose 0.1 percent. Note: Volumes and values series are seasonally adjusted.
More data
Use Infoshare to access time-series data.
Goods trade data
Subject category: Imports and exports
Group: Exports - summary data
Group: Imports - summary data
Group: Overseas trade statistics
Group: Re-exports - summary data
Overseas trade indexes
Subject category: Imports and exports
Group: Overseas trade indexes - prices - OTP
Group: Overseas trade indexes - volumes and values - OTV
Definitions and metadata
International trade statistics - DataInfo+ has metadata, methodologies, and definitions used in this release.
Technical enquiries (goods and services by country)
Aaron McRae
04 931 4600
[email protected]
Technical enquiries (overseas trade indexes)
Alex Koh
04 931 4688
[email protected]
ISSN 2703-6618
Next release
International trade: March 2025 quarter will be released on 3 June 2025.


