International trade statistics provide information on imports and exports of goods and services between New Zealand and our trading partners.
International trade: June 2024 quarter is our annual revisions release and includes changes to the calculation of travel credits among other series.
International trade: June 2024 quarter - data sources and methods under related pages has more information.
Key facts
Quarterly goods and services by country
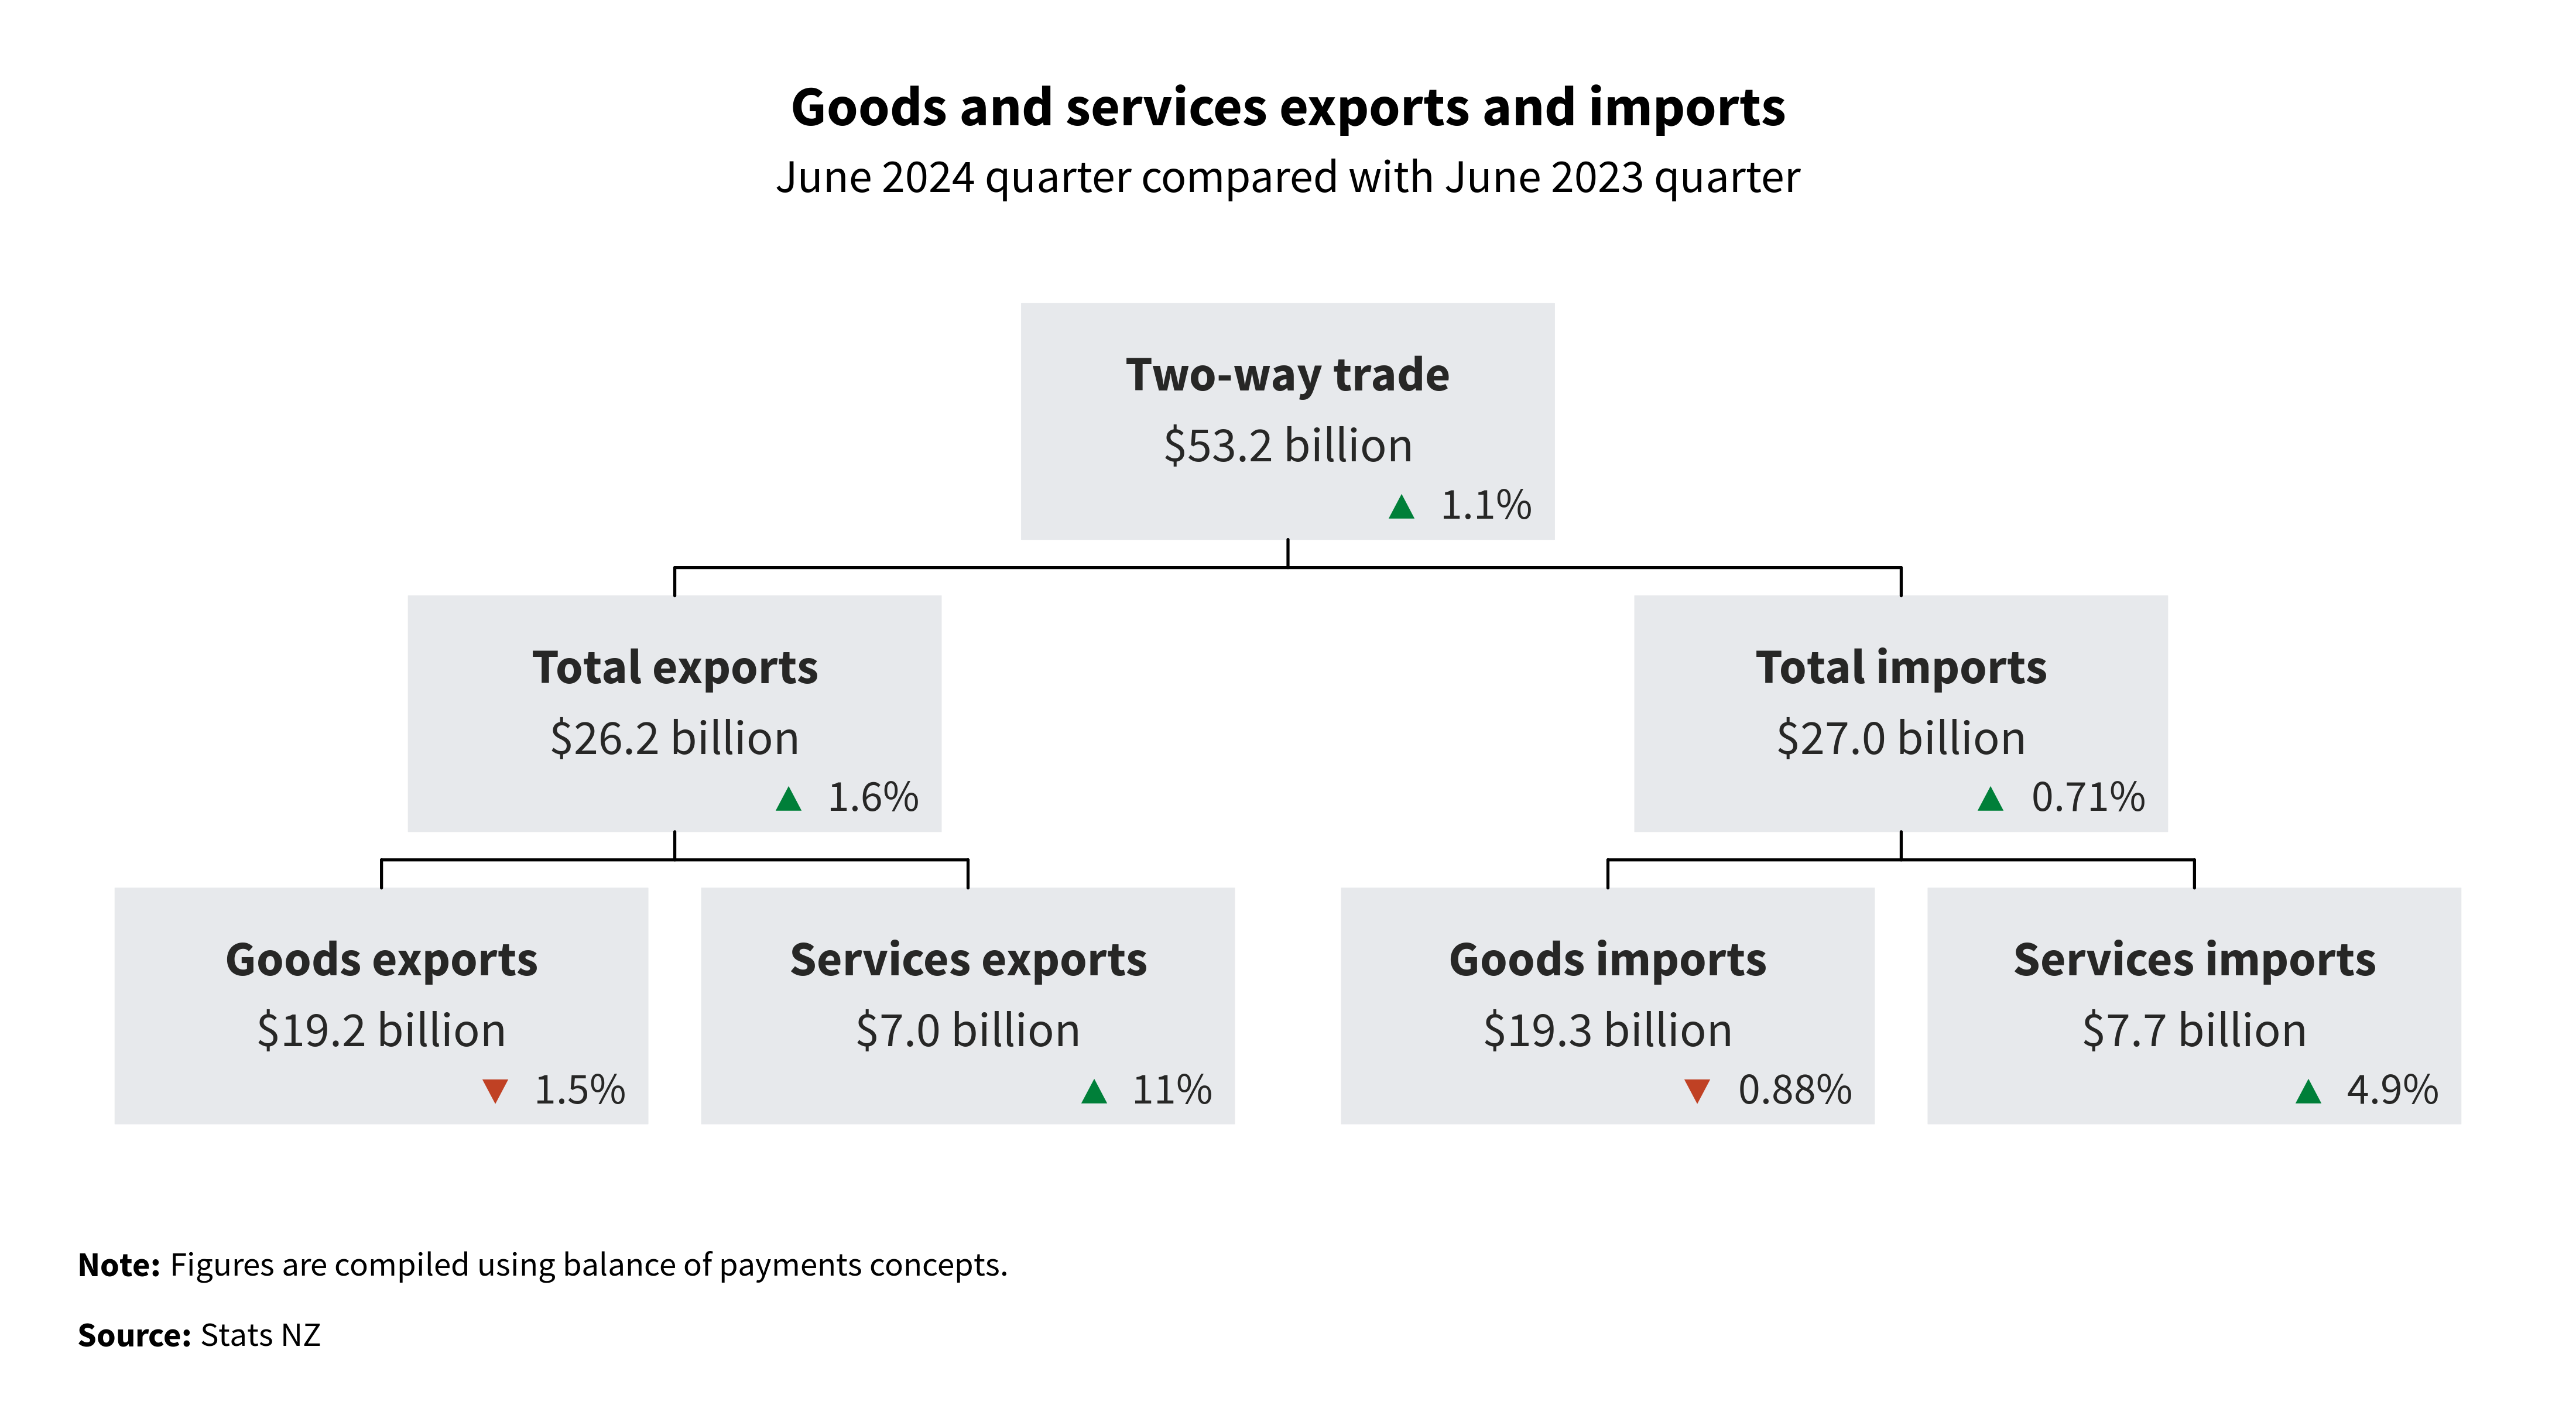
- Total exports of goods and services for the June 2024 quarter were $26.2 billion, up from $25.8 billion in the June 2023 quarter.
- Total imports of goods and services for the June 2024 quarter were $27.0 billion, up from $26.9 billion in the June 2023 quarter.
- The total two-way trade for the June 2024 quarter was $53.2 billion.
New Zealand international trade dashboard shows quarterly exports and imports data for goods and services by country and commodity type.
Total services exports rose $690 million to $7.0 billion in the June 2024 quarter compared with the June 2023 quarter.
The top movements of our services export categories in the June 2024 quarter compared with the June 2023 quarter were:
- travel services, up $556 million to $3.5 billion
- other business services, up $65 million to $798 million
- transportation services, up $54 million to $878 million
- government services, up $26 million to $76 million
- charges for the use of intellectual property services, down $1.3 million to $434 million.
Total service imports rose $363 million to $7.7 billion in the June 2024 quarter compared with the June 2023 quarter.
The top movements of our services import categories in the June 2024 quarter compared with the June 2023 quarter were:
- travel services, up $193 million to $1.7 billion
- other business services, up $165 million to $1.5 billion
- insurance and pension services, up $122 million to $899 million
- transportation services, down $112 million to $1.5 billion
- personal, cultural, and recreational services, down $84 million to $271 million.
Overseas merchandise trade: June 2024 has more information about the value of goods imports and exports in the June 2024 month.
Overseas trade indexes (OTI)
Movements are compared with the March 2024 quarter. All prices are unadjusted; all volumes and values are seasonally adjusted unless otherwise stated.
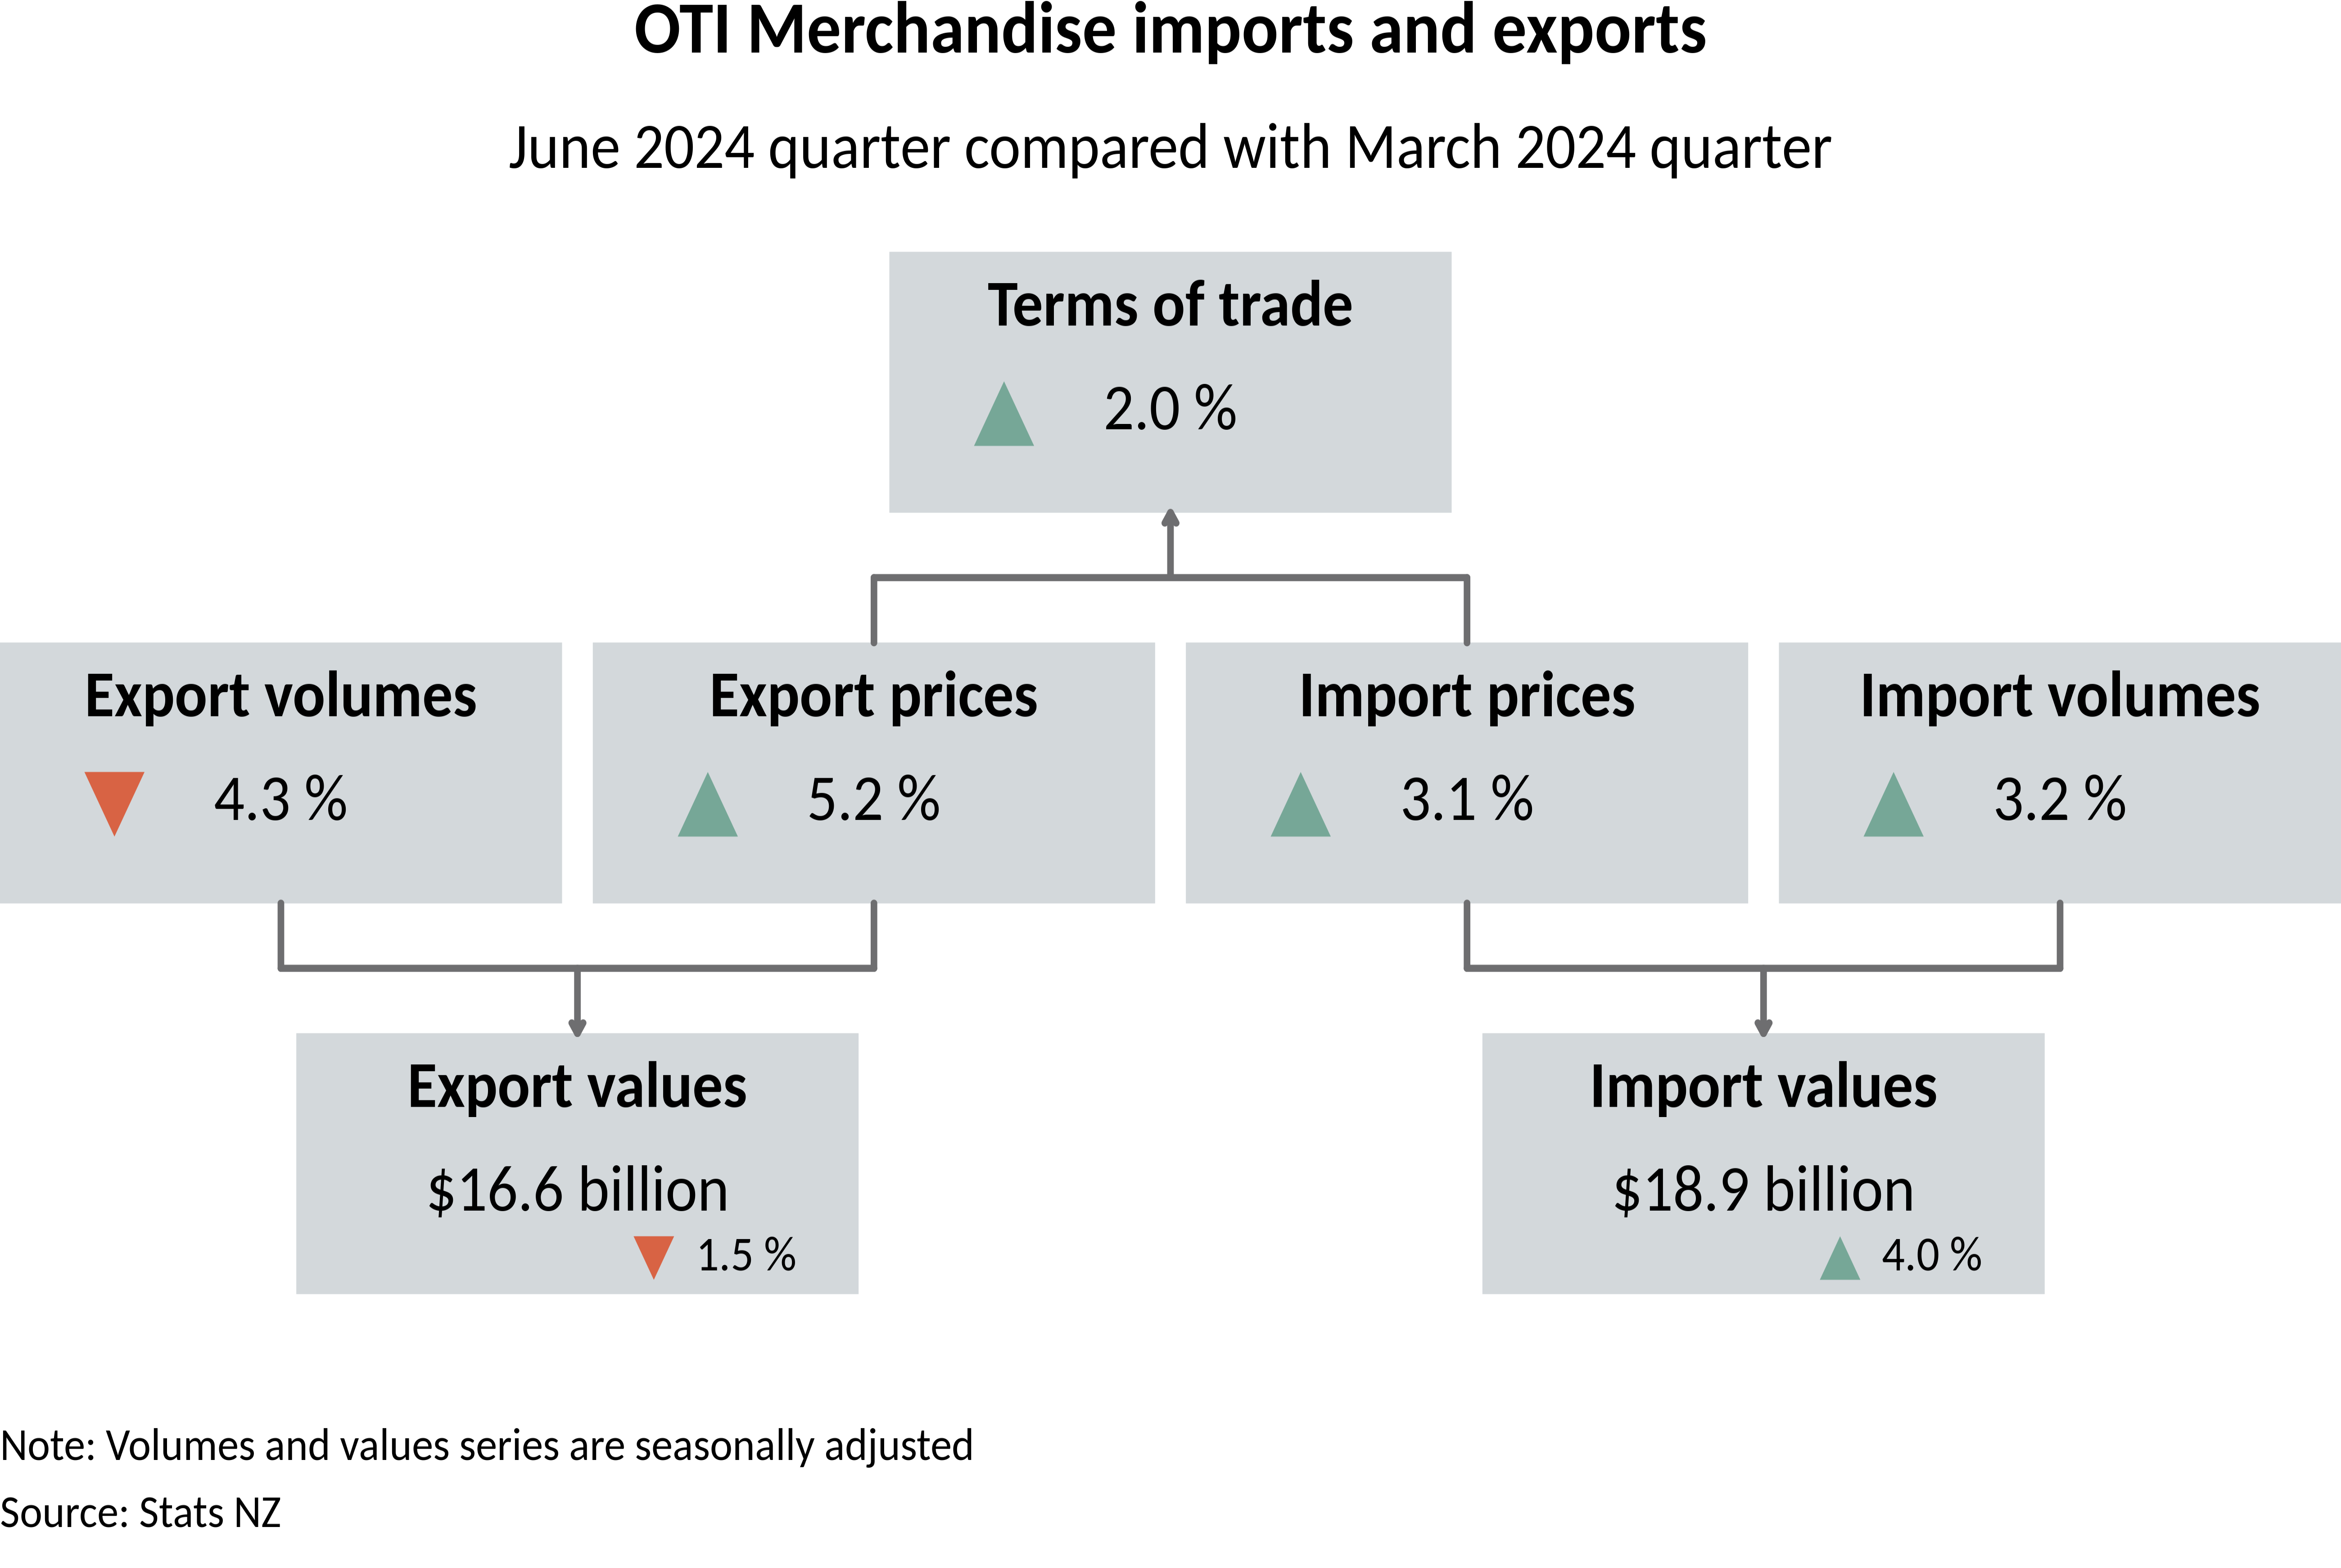
- The merchandise (goods) terms of trade rose 2.0 percent.
- Export prices for goods rose 5.2 percent and import prices rose 3.1 percent.
- Export volumes for goods fell 4.3 percent and import volumes rose 3.2 percent.
- Export values for goods fell 1.5 percent and import values rose 4.0 percent.
- The services terms of trade fell 8.6 percent.
- Services export prices fell 2.9 percent, while import prices rose 6.2 percent.
Exports
The main contributors to the export movements in the June 2024 quarter were:
- dairy prices rose 8.0 percent
- dairy volumes fell 10 percent, and values fell 8.0 percent
- meat prices rose 7.3 percent
- meat volumes rose 4.1 percent, and values rose 6.5 percent.
Imports
The main contributors to the import movements in the June 2024 quarter were:
- petroleum and petroleum product prices rose 4.0 percent
- petroleum and petroleum product volumes fell 8.0 percent, and values fell 4.4 percent.
Note: these volumes and values are not seasonally adjusted.
International Trade in Services & Royalties Survey (ITSS) data quality update
In the June 2024 quarter, the overall response rate was 75.8 percent, below the target response rate of 80 percent. The response rate for key firms was 87 percent, below the target response rate of 100 percent.
Declining response rates resulted in a higher level of imputation. We conducted additional quality assessment checks for any bias in the non-responding units to ensure our imputation model still holds. We found no concerns and ITSS data remained fit for purpose.
Late responses will be processed and revised for next quarter.
Text alternative for Goods and services exports and imports, June 2024 quarter compared with June 2023 quarter
Diagram shows two-way trade was up 1.1 percent to $53.2 billion. On the left-hand side of the diagram, total exports were up 1.6 percent to $26.2 billion. Goods exports were down 1.5 percent to $19.2 billion, and services exports were up 11 percent to $7.0 billion. On the right-hand side of the diagram, total imports were up 0.71 percent to $27.0 billion. Goods imports were down 0.88 percent to $19.3 billion, and services imports were up 4.9 percent to $7.7 billion. Note: Figures are compiled using balance of payments concepts.
Source: Stats NZ.
Text alternative for OTI merchandise imports and exports, June 2024 quarter compared with March 2024 quarter
Diagram shows the terms of trade rose 2.0 percent, where export prices rose 5.2 percent and import prices rose 3.1 percent. The value of exports fell 1.5 percent to $16.6 billion. Flowing into this were export volumes which fell 4.3 percent, and export prices which rose 5.2 percent. The value of imports rose 4.0 percent to $18.9 billion. Flowing into this were import volumes which rose 3.2 percent, and import prices which rose 3.1 percent. Note: Volumes and values series are seasonally adjusted.
Source: Stats NZ
More data
Use Infoshare to access time-series data.
Goods trade data
Subject category: Imports and exports
Group: Exports - summary data
Group: Imports - summary data
Group: Overseas trade statistics
Group: Re-exports - summary data
Overseas trade indexes
Subject category: Imports and exports
Group: Overseas trade indexes - prices - OTP
Group: Overseas trade indexes - volumes and values - OTV
Definitions and metadata
International trade statistics - DataInfo+ has metadata, methodologies, and definitions used in this release.
Technical enquiries (goods and services by country)
Aaron McRae
04 931 4600
[email protected]
Technical enquiries (overseas trade indexes)
Tom Kenny
04 931 4745
[email protected]
ISSN 2703-6618
Next release
International trade: September 2024 quarter will be released on 3 December 2024.


