International trade statistics provide information on imports and exports of goods and services between New Zealand and our trading partners.
Key facts
Quarterly goods and services by country
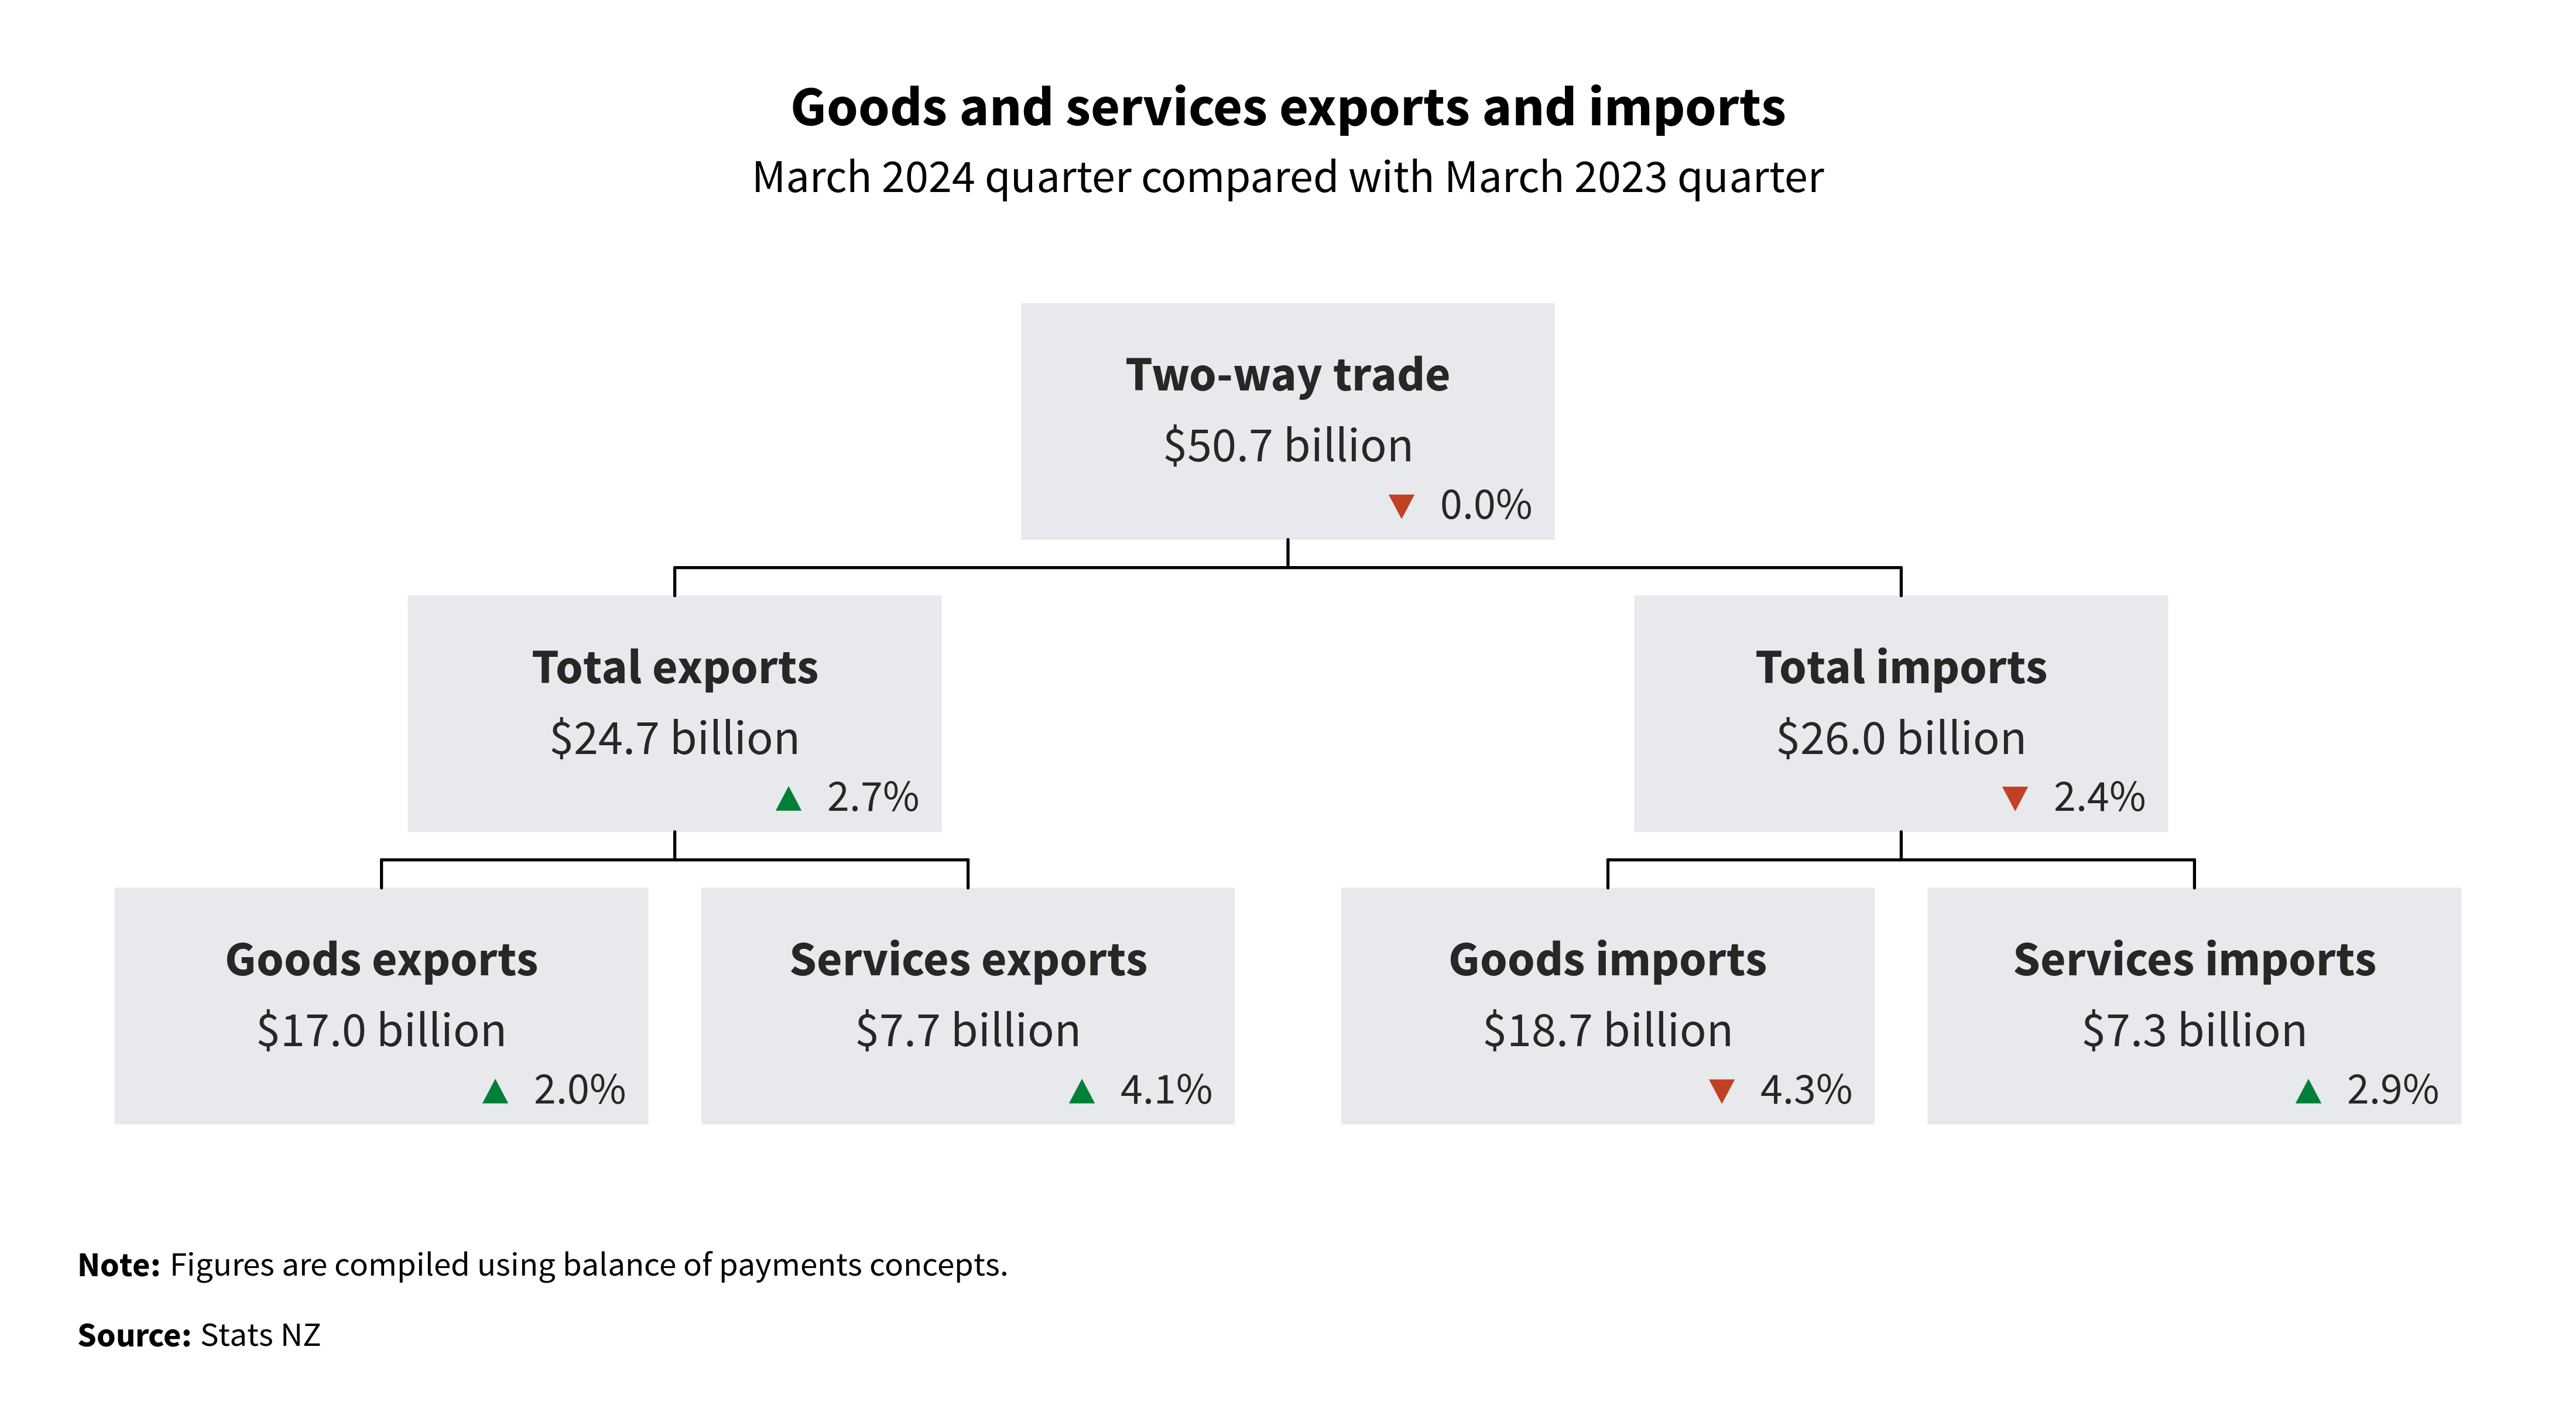
- Total exports of goods and services for the March 2024 quarter were $24.7 billion, up from $24.0 billion in the March 2023 quarter.
- Total imports of goods and services for the March 2024 quarter were $26.0 billion, down from $26.7 billion in the March 2023 quarter.
- The total two-way trade for the March 2024 quarter was $50.7 billion.
International trade dashboard shows quarterly exports and imports data for goods and services by country and commodity type.
Total services exports rose $302 million to $7.7 billion in the March 2024 quarter compared with the March 2023 quarter.
The top movements of our services export categories in the March 2024 quarter compared with the March 2023 quarter were:
- travel services, up $583 million to $4.2 billion
- transportation services, up $22 million to $1.1 billion
- charges for the use of intellectual property services, down $18 million to $435 million
- other business services, down $51 million to $675 million
- personal, cultural, and recreational services, down $118 million to $240 million.
Total services imports rose $203 million to $7.3 billion in the March 2024 quarter compared with the March 2023 quarter.
The top movements of our services import categories in the March 2024 quarter compared with the March 2023 quarter were:
- insurance and pension services, up $277 million to $955 million
- travel services, up $242 million to $1.6 billion
- telecommunication services, up $80 million to $871 million
- charges for the use of intellectual property services, up $38 million to $421 million
- transportation services, down $441 million to $1.5 billion.
Overseas merchandise trade: March 2024 has more information about the value of goods imports and exports in the March 2024 month.
Overseas trade indexes (OTI)
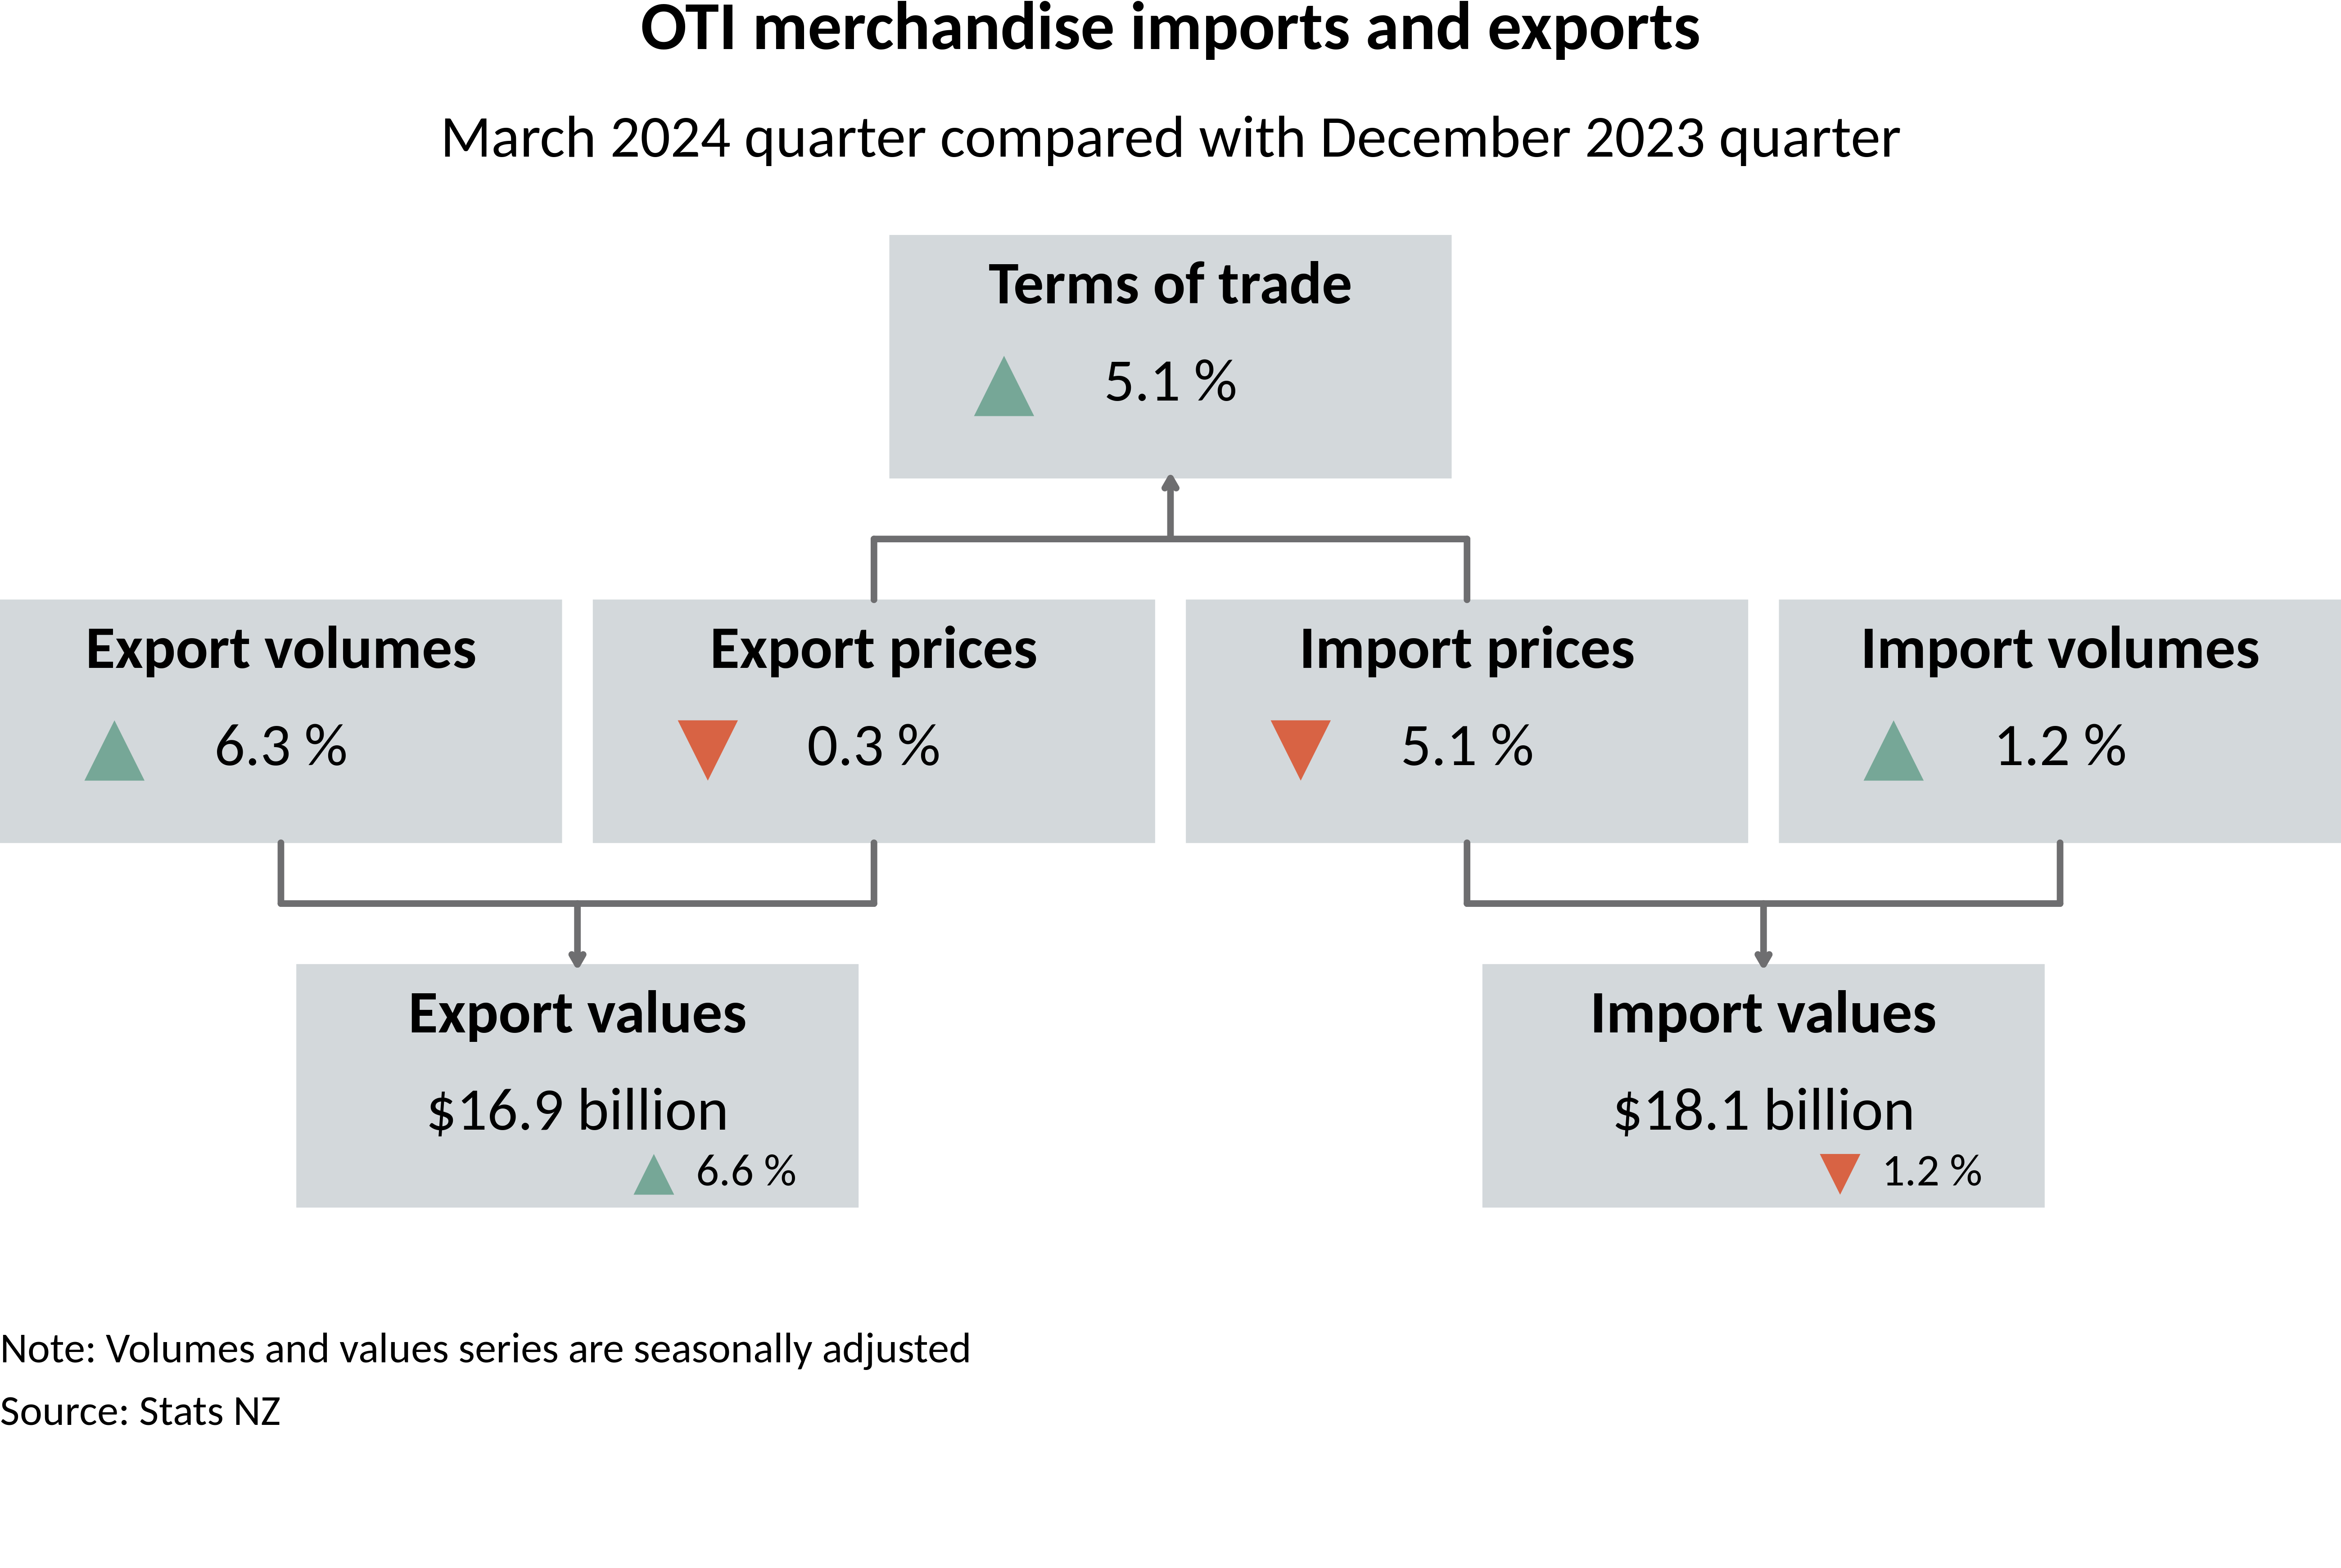
Movements are compared with the December 2023 quarter. All prices are unadjusted; all volumes and values are seasonally adjusted unless otherwise stated.
- The merchandise (goods) terms of trade rose 5.1 percent.
- Export prices for goods fell 0.3 percent and import prices fell 5.1 percent.
- Export volumes for goods rose 6.3 percent and import volumes rose 1.2 percent.
- Export values for goods rose 6.6 percent and import values fell 1.2 percent.
Text alternative for Goods and services exports and imports, March 2024 quarter compared with March 2023 quarter
The diagram shows two-way trade was little changed to $50.7 billion. On the left-hand side of the diagram, total exports were up 2.7 percent to $24.7 billion. Goods exports were up 2 percent to $17.0 billion, and services exports were up 4.1 percent to $7.7 billion. On the right-hand side of the diagram, total imports were down 2.4 percent to $26.0 billion. Goods imports were down 4.3 percent to $18.7 billion, and services imports were up 2.9 percent to $7.3 billion. Note: Figures are compiled using balance of payments concepts. Source: Stats NZ.
Text alternative for OTI merchandise imports and exports, March 2024 quarter compared with December 2023 quarter
Diagram shows the terms of trade rose 5.1 percent, where export prices fell 0.3 percent and import prices fell 5.1 percent. The value of exports rose 6.6 percent to $16.9 billion. Flowing into this were export volumes which rose 6.3 percent, and export prices which fell 0.3 percent. The value of imports fell 1.2 percent to $18.1 billion. Flowing into this were import volumes which rose 1.2 percent, and import prices which fell 5.1 percent. Note that the volumes and values series are seasonally adjusted. Source: Stats NZ.
More data
Use Infoshare to access time-series data.
Goods trade data
Subject category: Imports and exports
Group: Exports - summary data
Group: Imports - summary data
Group: Overseas trade statistics
Group: Re-exports - summary data
Overseas trade indexes
Subject category: Imports and exports
Group: Overseas trade indexes - prices - OTP
Group: Overseas trade indexes - volumes and values - OTV
Definitions and metadata
International trade statistics - DataInfo+ has metadata, methodologies, and definitions used in this release.
Technical enquiries (goods and services by country)
Aaron McRae
04 931 4600
[email protected]
Technical enquiries (overseas trade indexes)
Alex Koh
04 931 4673
[email protected]
ISSN 2703-6618
Next release
International trade: June 2024 quarter will be released on 3 September 2024.


