NASA's Scientific Visualization Studio
For the first time, NASA data about nitrogen dioxide (NO2), a harmful air pollutant, is available in the Environmental Protection Agency's (EPA) widely used Environmental Justice Screening and Mapping Tool (EJScreen). This update marks a crucial step in addressing air quality disparities in overburdened communities across the United States.
"Having access to this accurate and localized NO2 data allows organizations like ours to understand the air quality challenges we encounter, and to advocate more effectively for the health and well-being of community residents," said Samuel Jordan, president of the Baltimore Transit Equity Coalition.
Previously, EJScreen included data on ozone, fine particulate matter, and various other environmental hazards. But it lacked information on NO2, which has been linked to respiratory issues such as asthma, especially in children.
"Incorporating NO2 data into EJScreen is a testament to how NASA's Earth science capabilities can be applied to address crucial societal challenges," said John Haynes, NASA's program manager for Health and Air Quality. "This collaboration with the EPA underscores our commitment to using space-based observations to benefit public health and environmental justice."
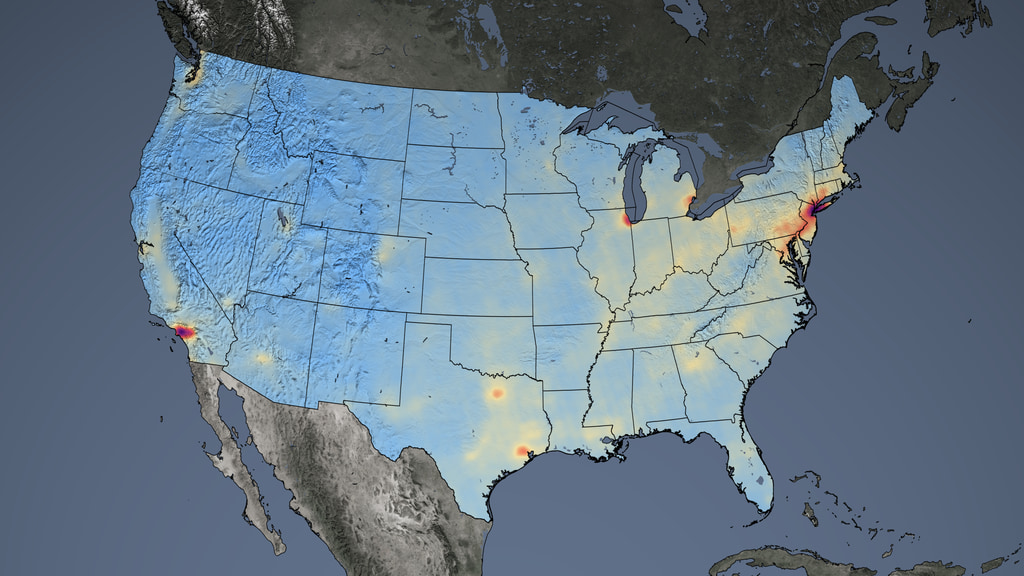
NO2 is emitted by burning fossil fuels and contributes to the formation of surface ozone. Communities of color and lower-income populations often live closer to highways, factories, transportation hubs, and other NO2 sources than their wealthier counterparts. As a result, residents are exposed to higher levels of this air pollutant and others, exacerbating health inequalities.
For example, a new NASA-funded study used satellite data and other information to show that nearly 150,000 warehouses in the U.S. increase local NO2 levels and are predominantly located in marginalized communities. The findings reveal a 20% increase, on average, in near-warehouse NO2, linked to truck traffic and warehouse density.
"NO2 is very short-lived in the air, and so its levels are high in the area where it is emitted," said Gaige Kerr, study coauthor and an air pollution researcher at George Washington University in Washington, who was involved in incorporating NASA's NO2 data into EJScreen. "This tool democratizes access to high-quality NO2 data, allowing individuals without a background in data analysis or data visualization to access and understand the information easily."
EJScreen uses data from the Ozone Monitoring Instrument (OMI) on NASA's Aura satellite and computer models to provide average annual NO2estimates at the census block level, revealing the amount of chronic surface-level NO2 that people may be exposed to in their neighborhoods.
"Satellite data has the potential to transform the measurement of certain environmental and climate factors," said Tai Lung, an environmental protection specialist with EPA and EJScreen lead. "The consistency of NASA's NO2 data for every corner of the U.S. makes it tremendously valuable for screening and mapping of disproportionate impacts in communities."
The dataset was developed with contributions from George Washington University, the University of Washington School of Medicine in Seattle, and Oregon State University in Corvallis. The data integration was made possible through a NASA grant to the Satellite Data for Environmental Justice Tiger Team (part of NASA's Health and Air Quality Applied Sciences Team), which worked closely with the EPA to ensure the data's accuracy and relevance.
NASA uses a variety of instruments on satellites, aircraft, and ground stations to continually gather data on key air pollutants. Scientists supported by NASA and other researchers monitor the origins, levels, and atmospheric movement of these pollutants. Their research offers crucial Earth-observation data that can guide air quality standards, shape public policies, and inform government regulations, ultimately aiming to enhance economic and human welfare.
The Aura satellite recently celebrated its 20-year anniversary. In the future, Kerr said, the team could explore using NO2 data from NASA's new TEMPO (Tropospheric Emissions: Monitoring of Pollution) instrument on the Intelsat commercial satellite.
TEMPO launched in 2023 and offers hourly daytime measurements, rather than OMI's once-daily measurements. This capability could further enhance the EPA tool, providing insight on pollution levels throughout the day and supporting proactive air pollution management.
By Emily DeMarco
NASA's Goddard Space Flight Center, Greenbelt, Md.


