Newmont Corporation (NYSE: NEM, ASX: NEM, TSX: NGT, PNGX: NEM) (Newmont or the Company) reported gold Mineral Reserves ("reserves") of 134.1 million attributable ounces at the end of 2024 compared to the Company's 135.9 million attributable ounces at the end of 2023, inclusive of assets held for divestment. Newmont's go-forward Tier 11 portfolio includes 125.5 million attributable gold ounces and significant Mineral Reserves from other metals, including more than 13.5 million attributable tonnes of copper reserves and 530 million attributable ounces of silver reserves.
This press release features multimedia. View the full release here: https://www.businesswire.com/news/home/20250220938621/en/
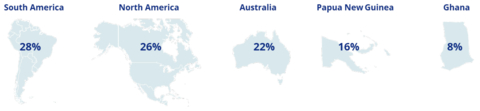
Percentage of Gold Reserves by Jurisdiction (Graphic: Business Wire)
"Newmont has solidified its position as the gold industry's leader with the highest concentration of Tier 1 assets, reserves and resources," said Tom Palmer, Newmont's President and Chief Executive Officer. "Supported by our industry-leading exploration program, we continue to focus on extending mine life, developing districts and discovering new opportunities in the most favorable mining jurisdictions. Newmont's extensive gold and copper reserve base represents the foundation for stable production and meaningful value creation for the next several decades."
2024 Reserves & Resources Highlights
- The gold industry's largest reserve base with 134.1 million attributable ounces, inclusive of the assets held for divestment (125.5 million attributable ounces for the go-forward Tier 1 portfolio); 2024 reserves include updates to gold price and cost escalation assumptions, additions, net revisions and depletion
- Newmont's reserve base has approximately doubled since 2018 and is strategically diversified across the world's most favorable mining jurisdictions
- Newmont benefits from a strong operating asset base with gold reserve life of ten years or more at Boddington, Lihir, Cadia, Tanami, Ahafo, Merian, Cerro Negro, Pueblo Viejo and Nevada Gold Mines (NGM), further enhanced by a broader portfolio and organic project pipeline
- Measured & Indicated Gold Mineral Resources2 of 99.4 million attributable ounces (90.5 million attributable ounces for the Tier 1 portfolio) and Inferred Resources of 70.6 million attributable ounces (64.9 million attributable ounces for the Tier 1 portfolio)
- Significant exposure to copper with 13.5 million attributable tonnes in reserves, 14.1 million attributable tonnes in Measured & Indicated resources and 11.0 million attributable tonnes in Inferred resources for the Tier 1 portfolio
- Additional exposure to other metals including silver, lead, zinc and molybdenum
Percentage of Gold Reserves by Jurisdiction3
Newmont's reserve base is a key differentiator with an average reserve grade of 0.96 grams per tonne and an operating reserve life of more than ten years at seven managed sites and two non-managed joint ventures, with significant upside potential from a robust organic project pipeline. In addition, Newmont has substantial exposure to other metals, with 89.5 million gold equivalent ounces4 of attributable reserves from copper, silver, lead, zinc and molybdenum.
PROVEN & PROBABLE GOLD RESERVES
For 2024, Newmont reported 134.1 million attributable ounces of gold reserves, slightly lower than the prior year total of 135.9 million attributable ounces. Depletion of 7.8 million ounces and unfavorable net revisions of 3.9 million ounces were largely offset by the reserve increases from price related revisions (14.2 million ounces), net of cost escalation assumptions (7.2 million ounces), as well as the addition of 2.9 million ounces from exploration.
Newmont's gold grade reserve remained substantially unchanged at 0.96 grams per tonne compared to 0.97 grams per tonne in the prior year.
ASSET-LEVEL SUMMARY
Managed Tier 1 Assets
- Boddington reserves increased by 13 percent to 10.8 million ounces, primarily driven by favorable price related revisions of 1.6 million ounces (net of cost escalation assumptions), as well as net positive revisions of 0.2 million ounces, partially offset by 0.6 million ounces from depletion
- Tanami reserves increased by 6 percent to 5.1 million ounces as a result of net favorable price and cost escalation related revisions of 0.2 million ounces and net positive revisions of 0.3 million ounces, partially offset by depletion of 0.4 million ounces
- Cadia reserves decreased slightly by 4 percent to 14.1 million ounces, primarily driven by depletion of 0.6 million ounces
- Ahafo South reserves decreased by 10 percent to 4.6 million ounces largely due to the depletion of 0.9 million ounces; price related revisions (net of cost escalation assumptions) resulted in an additional reduction of 0.2 million ounces, while 0.2 and 0.1 million ounces were added through exploration and favorable net revisions, respectively
- Lihir reserves decreased by 10 percent to 15.8 million ounces as favorable price related revisions of 1.8 million ounces (net of cost escalation assumptions) were offset by unfavorable net revisions of 2.9 million ounces, largely due to pit design updates and geotechnical changes, as well as depletion of 0.7 million ounces
- Peñasquito reserves decreased by 11 percent to 4.1 million ounces largely due to the depletion of 0.6 million ounces
Emerging Tier 1 Assets
- Merian reserves increased by 5 percent to 4.1 million ounces, primarily due to favorable price related revisions of 0.3 million ounces (net of cost escalation assumptions), as well as 0.2 million ounces added through exploration
- Cerro Negro reserves remained largely unchanged at 3.2 million ounces
- Yanacocha reserves decreased slightly by 4 percent to 5.3 million ounces largely due to the depletion of 0.4 million ounces, partially offset by favorable net revisions of 0.2 million ounces
- Red Chris reserves decreased by 5 percent to 3.7 million ounces due to net unfavorable revisions of 0.1 million ounces, as well as 0.1 million ounces from unfavorable price and cost escalation revisions and depletion
- Brucejack reserves decreased by 39 percent to 1.9 million ounces, primarily due to unfavorable net revisions of 1.5 million ounces due to updated resource model assumptions, including tighter drill hole spacing requirements and other technical considerations, partially offset by net favorable price and cost escalation related revisions of 0.3 million ounces and exploration additions of 0.3 million ounces
Non-Managed Tier 1 Assets
- Newmont's 38.5 percent interest in NGM represented 17.9 million attributable ounces of gold reserves at year end, compared to 18.3 million ounces at the end of 2023
- Newmont's 40 percent interest in Pueblo Viejo represented 8.2 million attributable ounces of gold reserves at year end, compared to 8.0 million ounces at the end of 2023
Assets Held for Sale
Reserves at the assets held for sale increased by 14 percent to 8.7 million ounces, primarily driven by net favorable price and cost escalation related revisions of 2.0 million ounces, in addition to 0.9 million ounces added through exploration. These favorable increases were partially offset by the depletion of 1.3 million ounces and net unfavorable revisions of 0.4 million ounces.
GOLD RESOURCES5,6
At the end of 2024, Newmont reported Measured and Indicated Gold Mineral Resources of 99.4 million attributable ounces, a 5 percent decrease from the prior year total of 104.8 million attributable ounces. Inferred Gold Mineral Resources totaled 70.6 million attributable ounces, a 2 percent increase from the prior year total of 69.1 million attributable ounces. Exclusive of the assets divested in 2024, total mineral resources remained substantially unchanged as resource conversions to reserves and unfavorable net revisions were offset by the resource increases from price related revisions, net of cost escalation assumptions, as well as additions through exploration.
Total Mineral Resources at Newmont's go-forward Tier 1 portfolio were largely unchanged from 2023. Net favorable resource increases from the price and cost escalation related revisions of 7.2 million ounces, as well as 3.2 million ounces added through exploration at Ahafo North (0.9 million ounces), Merian (0.8 million ounces), Brucejack (0.5 million ounces), Tanami (0.5 million ounces), Ahafo South (0.3 million ounces) and Cerro Negro (0.2 million ounces) were the primary drivers of the resource increases in 2024. This was offset by resource conversion of 5.9 million ounces and 4.6 million ounces from net unfavorable revisions.
Total Mineral Resources from assets held for sale increased by 0.5 million ounces, primarily driven by Musselwhite, Porcupine and Éléonore, partially offset by a decrease of 0.2 million ounces at CC&V and Akyem.
Newmont's Measured and Indicated Gold Mineral Resource grade increased to 0.59 grams per tonne compared to 0.57 grams per tonne in the prior year. Inferred Gold Mineral Resource decreased to 0.55 grams per tonne compared to 0.57 grams per tonne in the prior year.
OTHER METALS
In 2024, copper reserves and resources were materially unchanged. Copper reserves decreased slightly to 13.5 million tonnes from 13.7 million tonnes in the prior year, primarily due to depletion. Measured and Indicated copper resources decreased to 14.1 million tonnes from 15.0 million tonnes. Inferred copper resources increased slightly to 11.0 million tonnes from 10.9 million tonnes.
Silver reserves decreased to 530 million ounces compared to 596 million ounces in the prior year, primarily due to depletion. Silver resources increased during the year due to the impact of the net positive revisions and the downstream effect of increased gold price. Measured and Indicated silver resources increased to 469 million ounces from 457 million ounces in the prior year. Inferred silver resources increased to 113 million ounces from 108 million ounces in the prior year.
Lead reserves decreased slightly to 0.8 million tonnes from 0.9 million tonnes primarily due to depletion. Measured and Indicated lead resources decreased to 0.5 million tonnes from 0.6 million tonnes, and Inferred lead resources remained unchanged at 0.1 million tonnes. Zinc reserves decreased to 1.7 million tonnes from 2.2 million tonnes primarily due to depletion and negative revisions at Peñasquito. Measured and Indicated zinc resources decreased to 1.2 million tonnes from 1.5 million tonnes, and Inferred zinc resources remained unchanged at 0.1 million tonnes.
Molybdenum reserves were largely unchanged at 0.2 million tonnes. Measured and Indicated molybdenum resources remained unchanged at 0.1 million tonnes, with Inferred molybdenum resources of 0.1 million tonnes.
EXPLORATION OUTLOOK
Newmont's attributable exploration expenditure for managed operations is expected to be approximately $250 million in 2025 with 75 percent of total exploration investment dedicated to near-mine expansion programs and brownfields with the remaining 25 percent allocated to the advancement of greenfield projects.
Additionally, Newmont's share of exploration investment for its non-managed operations is expected to be approximately $25 million, for a total consolidated exploration expense outlook of $275 million for 2025.
Geographically, Newmont expects to invest approximately 37 percent in Latin America and the Caribbean, 20 percent in North America, 20 percent in Ghana, 16 percent in Australia and the remainder in Papua New Guinea and other locations.
UPDATED GOLD PRICE FOR MINERAL RESERVES AND MINERAL RESOURCES
As part of the annual Mineral Reserves and Mineral Resources update, Newmont assesses the metal price assumptions used for the calculation of end year reserves and resources. Since Newmont last updated its gold price assumptions at year end 2022, gold price has increased meaningfully to $2,629 per ounce as of December 31, 2024, representing a 44 percent increase from $1,820 per ounce as of December 31, 2022. In addition to the sustained increase in the spot gold price, long-term broker consensus estimates are currently substantially higher.
In line with market conditions, Newmont has increased its reserves gold price assumption by 21 percent to $1,700 from $1,400 per ounce. Newmont's updated reserves gold price is approximately 17 percent lower than the three-year trailing gold price average of $2,050 per ounce, well below Newmont's historical average of approximately 13 percent over the last ten years (2014 - 2023). Consistent with Newmont's historical approach, the resources gold price has been calibrated higher than reserves, as this helps the Company's technical teams to identify the optimum areas to further expand the life of our assets and to target where additional drilling and study work is required at our operating mines. For 2024, mineral resources are based on a $2,000 per ounce, maintaining the historical level above reserve pricing of 15 to 20 percent.
Newmont's robust internal processes and proven track record of responsibly and rigorously defining reserves and resources will continue to support the development of the go-forward operating Tier 1 portfolio and organic project pipeline.
GOLD RESERVE SENSITIVITY
A $100 increase in gold price would result in an approximate 6 percent increase in gold reserves while a $100 decrease in gold price would result in an approximate 6 percent decrease in gold reserves. These sensitivities assume an oil price of $75 per barrel (WTI), Australian dollar exchange rate of $0.70 and Canadian dollar exchange rate of $0.75. These sensitivities assume all other inputs remain equal, including all cost and capital assumptions, which may also have a material impact on these approximate estimates.
KEY RESERVE AND RESOURCE ASSUMPTIONS7
At December 31, |
||
2024 |
2023 |
|
Gold Reserves ($/oz) |
$1,700 |
$1,400 |
Gold Resources ($/oz) |
$2,000 |
$1,600 |
Copper Reserves ($/lb) |
$3.50 |
$3.50 |
Copper Resources ($/lb) |
$4.00 |
$4.00 |
Silver Reserves ($/oz) |
$20.00 |
$20.00 |
Silver Resources ($/oz) |
$23.00 |
$23.00 |
Lead Reserves ($/lb) |
$0.90 |
$1.00 |
Lead Resources ($/lb) |
$1.00 |
$1.20 |
Zinc Reserves ($/lb) |
$1.20 |
$1.20 |
Zinc Resources ($/lb) |
$1.30 |
$1.45 |
Molybdenum Reserves ($/lb) |
$13.00 |
$8.00 |
Molybdenum Resources ($/lb) |
$16.00 |
$10.00 |
Tungsten Resources ($/lb) |
N/A |
$16.00 |
Australian Dollar (A$:US$) |
$0.70 |
$0.70 |
Canadian Dollar (C$:US$) |
$0.75 |
$0.75 |
West Texas Intermediate ($/bbl) |
$75.00 |
$75.00 |
For additional details on Newmont's reported gold, copper, silver, lead, zinc, molybdenum and tungsten Mineral Reserves and Mineral Resources, please refer to the tables at the end of this release.


