Overseas merchandise trade statistics provide information on imports and exports of merchandise goods between New Zealand and other countries.
Key facts
This release refers to trade in goods only.
In January 2025, compared with January 2024:
- goods exports rose by $1.4 billion (28 percent), to $6.2 billion
- goods imports rose by $787 million (13 percent), to $6.7 billion
- the monthly trade balance was a deficit of $486 million.
| Year | Exports | Imports |
| 2005 | 2252426665 | 2554437092 |
| 2006 | 2199098566 | 3092867214 |
| 2007 | 2483864806 | 3308760509 |
| 2008 | 3083488518 | 3394142406 |
| 2009 | 3172202817 | 3274117314 |
| 2010 | 3154448602 | 2886334379 |
| 2011 | 3306376396 | 3297837844 |
| 2012 | 3726830894 | 3887587657 |
| 2013 | 3347037981 | 3640765993 |
| 2014 | 4823609589 | 3783380147 |
| 2015 | 3680849221 | 3628692568 |
| 2016 | 3894764530 | 3882444299 |
| 2016 | 3935549305 | 4162092352 |
| 2018 | 4275245564 | 4937667058 |
| 2019 | 4344482506 | 5279409037 |
| 2020 | 4677676997 | 5073312008 |
| 2021 | 4116745461 | 4846510899 |
| 2022 | 4801909858 | 5908654153 |
| 2023 | 5308106709 | 7403344607 |
| 2024 | 4823609589 | 5887780127 |
| 2025 | 6189659964 | 6675259323 |
Text alternative for Goods exports and imports, January 2025 month compared with January 2024 month.
Exports
Goods exports rose by $1.4 billion (28 percent) in January 2025 (to $6.2 billion), compared with January 2024.
Milk powder, butter, and cheese lead exports rise
Milk powder, butter, and cheese rose $787 million (45 percent), to $2.6 billion.
January 2025 value ($ million) |
Change in value ($ million) |
Change in value |
Change in quantity |
Change in unit price |
|
Milk powder, butter, and cheese |
2,554 |
787 |
45% |
* |
* |
Milk powder |
1,294 |
339 |
36% |
6.3% |
27% |
Milk fats (including butter) |
624 |
243 |
64% |
12% |
46% |
Cheese |
322 |
115 |
55% |
33% |
17% |
Fresh milk and cream |
153 |
18 |
13% |
* |
* |
* Changes in total quantity and unit price are omitted due to differences in units of measure. |
|||||
Other dairy-based products, including infant formula and casein and caseinates, rose during this period.
January 2025 value ($ million) |
Change in value ($ million) |
Change in value |
Change in quantity |
Change in unit price |
|
Infant formula |
153 |
24 |
18% |
21% |
-1.7% |
Casein and caseinates |
147 |
26 |
21% |
22% |
-0.4% |
Infant formula is included in preparations of milk, cereals, flour, and starch, which rose $42 million (25 percent), to $208 million.
Meat and edible offal rose $178 million (28 percent), to $811 million.
January 2025 value ($ million) |
Change in value ($ million) |
Change in value |
Change in quantity |
Change in unit price |
|
Meat and edible offal |
811 |
178 |
28% |
2.7% |
25% |
Frozen beef |
365 |
95 |
35% |
5.7% |
28% |
Sheep meat |
359 |
66 |
22% |
0.3% |
22% |
Chilled beef |
44 |
13 |
42% |
15% |
23% |
Top monthly export movements by country
The monthly movements in January 2025 compared with January 2024 for our top export partners (in order of total annual goods exports) were:
- China: total exports were up $377 million (27 percent).
- The largest rises were milk powder, butter, and cheese, up $322 million; logs, wood, and wood articles, up $38 million; and meat and edible offal, up $35 million.
- The largest falls were crude oil, down $30 million, and pharmaceutical products, down $13 million.
- USA: total exports were up $244 million (49 percent).
- The largest rises were meat and edible offal, up $82 million; wine, up $58 million; and milk powder, butter, and cheese, up $42 million.
- There were no significant falls over $10 million.
- Australia: total exports were up $131 million (24 percent).
- The largest rises were precious metals, jewellery, and coins, up $55 million; milk powder, butter, and cheese, up $29 million; and iron and steel, and articles, up $15 million.
- The largest fall was mechanical machinery and equipment, down $14 million.
- EU: total exports were up $75 million (27 percent).
- The largest rises were mechanical machinery and equipment, up $55 million; milk powder, butter, and cheese, up $23 million; and aluminium and aluminium articles, up $15 million.
- There were no significant falls over $10 million.
- Japan: total exports were up $60 million (30 percent).
- The largest rise was milk powder, butter, and cheese, up $38 million.
- There were no significant falls over $10 million.
Imports
Goods imports rose by $787 million (13 percent) in January 2025 (to $6.7 billion), compared with January 2024.
Mechanical machinery and equipment lead imports rise
Mechanical machinery and equipment increased by $338 million (46 percent), reaching a total of $1.1 billion. The primary drivers of this growth were turbo-jets and turbo-propellers, which significantly increased by $242 million (178 percent) to $377 million, and computers, which rose by $36 million (34 percent) to $143 million.
Passenger cars fell $3.7 million (1.0 percent), with some contrasting movement within this category. Hybrid car imports rose $36 million (37 percent) to $136 million, electric car imports fell by $42 million (57 percent) to $32 million, while petrol car imports remained at $145 million.
Top monthly import movements by country
The monthly movements in January 2025 compared with January 2024 for our top import partners (in order of total annual goods imports) were:
- China: total imports were down $8.1 million (0.6 percent).
- The largest rises were mechanical machinery and equipment, up $26 million; textiles and textile articles, up $14 million; and plastic and plastic articles, up $10 million.
- The largest falls were petroleum and products, down $32 million; vehicles, parts, and accessories, down $26 million; and fertilisers, down $20 million.
- EU: total imports were up $168 million (22 percent).
- The largest rises were mechanical machinery and equipment, up $56 million; aircraft and parts, up $53 million; and meat and edible offal, up $17 million.
- The largest fall was cereals, down $19 million.
- Australia: total imports were up $63 million (11 percent).
- The largest rises were inorganic chemicals, up $37 million, and ships, boats, and floating structures, up $12 million.
- The largest fall was cereals, down $13 million.
- USA: total imports were up $226 million (44 percent).
- The largest rises were mechanical machinery and equipment, up $195 million; pharmaceutical products, up $31 million; and electrical machinery and equipment, up $21 million.
- The largest falls were food residues, wastes, and fodder, down $33 million, and petroleum and products, down $15 million.
- South Korea: total imports were down $114 million (21 percent).
- The largest rise was electrical machinery and equipment, up $11 million.
- The largest fall was petroleum and products, down $137 million.
Trade deficit in January 2025
The monthly trade balance was a deficit of $486 million.
| Date | Trade Balance |
| Jan-16 | 12320231 |
| Feb-16 | 366925311 |
| Mar-16 | 188849850 |
| Apr-16 | 349530073 |
| May-16 | 343078843 |
| Jun-16 | 106790388 |
| Jul-16 | -351427805 |
| Aug-16 | -1239891851 |
| Sep-16 | -1387987389 |
| Oct-16 | -797651150 |
| Nov-16 | -723201112 |
| Dec-16 | -1435171 |
| Jan-17 | -226543047 |
| Feb-17 | -42276469 |
| Mar-17 | 261589138 |
| Apr-17 | 546879922 |
| May-17 | 62020162 |
| Jun-17 | 243117487 |
| Jul-17 | 92027349 |
| Aug-17 | -1174342582 |
| Sep-17 | -1165209854 |
| Oct-17 | -839633458 |
| Nov-17 | -1222417301 |
| Dec-17 | 614310559 |
| Jan-18 | -662421494 |
| Feb-18 | 188256546 |
| Mar-18 | -150609406 |
| Apr-18 | 199745211 |
| May-18 | 199288004 |
| Jun-18 | -285260079 |
| Jul-18 | -203110333 |
| Aug-18 | -1566757996 |
| Sep-18 | -1579921712 |
| Oct-18 | -1305105133 |
| Nov-18 | -1003973060 |
| Dec-18 | 9286883 |
| Jan-19 | -934926531 |
| Feb-19 | -93584137 |
| Mar-19 | 825181314 |
| Apr-19 | 360963002 |
| May-19 | 174927698 |
| Jun-19 | 329812747 |
| Jul-19 | -732335397 |
| Aug-19 | -1641634097 |
| Sep-19 | -1309937148 |
| Oct-19 | -1038380593 |
| Nov-19 | -786493088 |
| Dec-19 | 379772255 |
| Jan-20 | -395635011 |
| Feb-20 | 550639307 |
| Mar-20 | 522807892 |
| Apr-20 | 1374019783 |
| May-20 | 1222702687 |
| Jun-20 | 416538602 |
| Jul-20 | 387761796 |
| Aug-20 | -320606284 |
| Sep-20 | -1132334429 |
| Oct-20 | -465913506 |
| Nov-20 | 679104 |
| Dec-20 | 230069561 |
| Jan-21 | -729765438 |
| Feb-21 | 449847010 |
| Mar-21 | -182555509 |
| Apr-21 | 557914991 |
| May-21 | 404936125 |
| Jun-21 | 442108253 |
| Jul-21 | -387158502 |
| Aug-21 | -2132508281 |
| Sep-21 | -2166033786 |
| Oct-21 | -1282573004 |
| Nov-21 | -1085761728 |
| Dec-21 | -990246456 |
| Jan-22 | -1106744295 |
| Feb-22 | -714801157 |
| Mar-22 | -593488596 |
| Apr-22 | 469495559.5 |
| May-22 | 148263036 |
| Jun-22 | -1132868318 |
| Jul-22 | -1415192071 |
| Aug-22 | -2634137110 |
| Sep-22 | -2519671472 |
| Oct-22 | -2315527621 |
| Nov-22 | -2183787239 |
| Dec-22 | -650530508 |
| Jan-23 | -2095237898 |
| Feb-23 | -846757630 |
| Mar-23 | -1602490156 |
| Apr-23 | 220854073 |
| May-23 | 41615990.2 |
| Jun-23 | -114738381 |
| Jul-23 | -1174149043 |
| Aug-23 | -2266681329 |
| Sep-23 | -2420838856 |
| Oct-23 | -1732504563 |
| Nov-23 | -1258971689 |
| Dec-23 | -372771305 |
| Jan-24 | -1064170538 |
| Feb-24 | -318989147 |
| Mar-24 | 469883412 |
| Apr-24 | -11882445 |
| May-24 | 59494662 |
| Jun-24 | 577124190 |
| Jul-24 | -1021575122 |
| Aug-24 | -2316015330 |
| Sep-24 | -2166468080 |
| Oct-24 | -1653634248 |
| Nov-24 | -449377768 |
| Dec-24 | 93964350 |
| Jan-25 | -485599359 |
January 2025 year
Annual values are actual and compared with the year ended January 2024.
- Annual goods exports were valued at $72.2 billion, up $4.0 billion from the previous year.
- Annual goods imports were valued at $79.4 billion, down $1.3 billion from the previous year.
- The annual trade deficit was $7.2 billion. In the year ended January 2024, the annual trade deficit was $12.6 billion.
| Month | Trade balance |
| Jan-16 | -3576399416 |
| Feb-16 | -3293445747 |
| Mar-16 | -3765397257 |
| Apr-16 | -3599939057 |
| May-16 | -3624030736 |
| Jun-16 | -3335288185 |
| Jul-16 | -2956272033 |
| Aug-16 | -3105993844 |
| Sep-16 | -3353967015 |
| Oct-16 | -3246795580 |
| Nov-16 | -3174570464 |
| Dec-16 | -3134099782 |
| Jan-17 | -3372963060 |
| Feb-17 | -3782164840 |
| Mar-17 | -3709425552 |
| Apr-17 | -3512075703 |
| May-17 | -3793134384 |
| Jun-17 | -3656807285 |
| Jul-17 | -3213352131 |
| Aug-17 | -3147802862 |
| Sep-17 | -2925025327 |
| Oct-17 | -2967007635 |
| Nov-17 | -3466223824 |
| Dec-17 | -2850478094 |
| Jan-18 | -3286356541 |
| Feb-18 | -3055823526 |
| Mar-18 | -3468022070 |
| Apr-18 | -3815156781 |
| May-18 | -3677888939 |
| Jun-18 | -4206266505 |
| Jul-18 | -4501404187 |
| Aug-18 | -4893819601 |
| Sep-18 | -5308531459 |
| Oct-18 | -5774003134 |
| Nov-18 | -5555558893 |
| Dec-18 | -6160582569 |
| Jan-19 | -6433087606 |
| Feb-19 | -6714928289 |
| Mar-19 | -5739137569 |
| Apr-19 | -5577919778 |
| May-19 | -5602280084 |
| Jun-19 | -4987207258 |
| Jul-19 | -5516432322 |
| Aug-19 | -5591308423 |
| Sep-19 | -5321323859 |
| Oct-19 | -5054599319 |
| Nov-19 | -4837119347 |
| Dec-19 | -4466633975 |
| Jan-20 | -3927342455 |
| Feb-20 | -3283119011 |
| Mar-20 | -3585492433 |
| Apr-20 | -2572435652 |
| May-20 | -1524660663 |
| Jun-20 | -1437934808 |
| Jul-20 | -317837615 |
| Aug-20 | 1003190198 |
| Sep-20 | 1180792917 |
| Oct-20 | 1753260004 |
| Nov-20 | 2540432196 |
| Dec-20 | 2390729502 |
| Jan-21 | 2056599075 |
| Feb-21 | 1955806778 |
| Mar-21 | 1250443377 |
| Apr-21 | 434338585 |
| May-21 | -383427977 |
| Jun-21 | -357858326 |
| Jul-21 | -1132778624 |
| Aug-21 | -2944680621 |
| Sep-21 | -3978379978 |
| Oct-21 | -4795039476 |
| Nov-21 | -5881480308 |
| Dec-21 | -7101796325 |
| Jan-22 | -7478775182 |
| Feb-22 | -8643423349 |
| Mar-22 | -9054356436 |
| Apr-22 | -9142775867 |
| May-22 | -9399448956 |
| Jun-22 | -10974425528 |
| Jul-22 | -12002459097 |
| Aug-22 | -12504087926 |
| Sep-22 | -12857725612 |
| Oct-22 | -13890680229 |
| Nov-22 | -14988705740 |
| Dec-22 | -14648989792 |
| Jan-23 | -15637483395 |
| Feb-23 | -15769439868 |
| Mar-23 | -16778441428 |
| Apr-23 | -17027082914 |
| May-23 | -17133729960 |
| Jun-23 | -16115600023 |
| Jul-23 | -15874556995 |
| Aug-23 | -15507101214 |
| Sep-23 | -15408268598 |
| Oct-23 | -14825245540 |
| Nov-23 | -13900429990 |
| Dec-23 | -13622670787 |
| Jan-24 | -12591603427 |
| Feb-24 | -12063834944 |
| Mar-24 | -9991461376 |
| Apr-24 | -10224197894 |
| May-24 | -10206319222 |
| Jun-24 | -9514456651 |
| Jul-24 | -9361882730 |
| Aug-24 | -9411216731 |
| Sep-24 | -9156845955 |
| Oct-24 | -9077975640 |
| Nov-24 | -8268381719 |
| Dec-24 | -7801646064 |
| Jan-25 | -7223074885 |
| Month | Exports | Imports |
| Jan-16 | 49187466085 | 52763865501 |
| Feb-16 | 49537612567 | 52831058314 |
| Mar-16 | 48833243763 | 52598641020 |
| Apr-16 | 49026536183 | 52626475240 |
| May-16 | 49230155446 | 52854186182 |
| Jun-16 | 49324864243 | 52660152428 |
| Jul-16 | 49121608220 | 52077880253 |
| Aug-16 | 48793893786 | 51899887630 |
| Sep-16 | 48583604241 | 51937571256 |
| Oct-16 | 48696300602 | 51943096182 |
| Nov-16 | 48493856234 | 51668426698 |
| Dec-16 | 48486904078 | 51621003860 |
| Jan-17 | 48527688853 | 51900651913 |
| Feb-17 | 48305011954 | 52087176794 |
| Mar-17 | 48694076739 | 52403502291 |
| Apr-17 | 49076148830 | 52588224533 |
| May-17 | 49424472301 | 53217606685 |
| Jun-17 | 49873491508 | 53530298793 |
| Jul-17 | 50528773127 | 53742125258 |
| Aug-17 | 50834401328 | 53982204190 |
| Sep-17 | 51160043929 | 54085069256 |
| Oct-17 | 51791672041 | 54758679676 |
| Nov-17 | 52532859588 | 55999083412 |
| Dec-17 | 53625488161 | 56475966255 |
| Jan-18 | 53965184420 | 57251540961 |
| Feb-18 | 54395355682 | 57451179208 |
| Mar-18 | 54602966051 | 58070988121 |
| Apr-18 | 54860205151 | 58675361932 |
| May-18 | 55304076433 | 58981965372 |
| Jun-18 | 55490192916 | 59696459421 |
| Jul-18 | 56206201587 | 60707605774 |
| Aug-18 | 56493336022 | 61387155623 |
| Sep-18 | 56954044261 | 62262575720 |
| Oct-18 | 57226558637 | 63000561771 |
| Nov-18 | 57470599037 | 63026157930 |
| Dec-18 | 57251104265 | 63411686834 |
| Jan-19 | 57320341207 | 63753428813 |
| Feb-19 | 57583937302 | 64298865591 |
| Mar-19 | 58386241764 | 64125379333 |
| Apr-19 | 58900924296 | 64478844074 |
| May-19 | 59293597157 | 64895877241 |
| Jun-19 | 59378412551 | 64365619809 |
| Jul-19 | 58963308257 | 64479740579 |
| Aug-19 | 59050318141 | 64641626564 |
| Sep-19 | 59153331446 | 64474655305 |
| Oct-19 | 59330562863 | 64385162182 |
| Nov-19 | 59689705163 | 64526824510 |
| Dec-19 | 59899236281 | 64365870256 |
| Jan-20 | 60232430772 | 64159773227 |
| Feb-20 | 60412604751 | 63695723762 |
| Mar-20 | 60424643728 | 64010136161 |
| Apr-20 | 60267881085 | 62840316737 |
| May-20 | 59860029862 | 61384690525 |
| Jun-20 | 59923371349 | 61361306157 |
| Jul-20 | 59958852127 | 60276689742 |
| Aug-20 | 60267415950 | 59264225752 |
| Sep-20 | 59811824505 | 58631031588 |
| Oct-20 | 59608519266 | 57855259262 |
| Nov-20 | 59310670094 | 56770237898 |
| Dec-20 | 59352090268 | 56961360766 |
| Jan-21 | 58791158732 | 56734559657 |
| Feb-21 | 58648923039 | 56693116261 |
| Mar-21 | 58509007529 | 57258564152 |
| Apr-21 | 58727983912 | 58293645327 |
| May-21 | 59187764622 | 59571192599 |
| Jun-21 | 60317064345 | 60674922671 |
| Jul-21 | 61137731227 | 62270509851 |
| Aug-21 | 61130377632 | 64075058253 |
| Sep-21 | 61626437404 | 65604817382 |
| Oct-21 | 62203301840 | 66998341316 |
| Nov-21 | 62957144846 | 68838625154 |
| Dec-21 | 63494172023 | 70595968348 |
| Jan-22 | 64179336420 | 71658111602 |
| Feb-22 | 64623309414 | 73266732763 |
| Mar-22 | 65620086364 | 74674442800 |
| Apr-22 | 66238532811 | 75381308679 |
| May-22 | 67249624549 | 76649073506 |
| Jun-22 | 67320451696 | 78294877224 |
| Jul-22 | 67880911372 | 79883370469 |
| Aug-22 | 68799762323 | 81303850249 |
| Sep-22 | 70313919973 | 83171645585 |
| Oct-22 | 70886872314 | 84777552543 |
| Nov-22 | 71544229919 | 86532935659 |
| Dec-22 | 71970611821 | 86619601613 |
| Jan-23 | 72476808672 | 88114292067 |
| Feb-23 | 72353029898 | 88122469766 |
| Mar-23 | 72141630258 | 88920071686 |
| Apr-23 | 72569483052 | 89596565966 |
| May-23 | 72717557731 | 89851287691 |
| Jun-23 | 72672011431 | 88787611454 |
| Jul-23 | 71711512987 | 87586069982 |
| Aug-23 | 71402878992 | 86909980206 |
| Sep-23 | 70258409955 | 85666678553 |
| Oct-23 | 69672337565 | 84497583105 |
| Nov-23 | 69280620301 | 83181050291 |
| Dec-23 | 68620962133 | 82243632920 |
| Jan-24 | 68136465013 | 80728068440 |
| Feb-24 | 68854669181 | 80918504125 |
| Mar-24 | 68969169693 | 78960631069 |
| Apr-24 | 68673149211 | 78897347105 |
| May-24 | 68719391678 | 78925710900 |
| Jun-24 | 68567972772 | 78082429423 |
| Jul-24 | 69269795361 | 78631678091 |
| Aug-24 | 69130797935 | 78542014666 |
| Sep-24 | 69260320778 | 78417166733 |
| Oct-24 | 69512025393 | 78590001033 |
| Nov-24 | 69977088417 | 78245470136 |
| Dec-24 | 70803770907 | 78605416971 |
| Jan-25 | 72169821282 | 79392896167 |
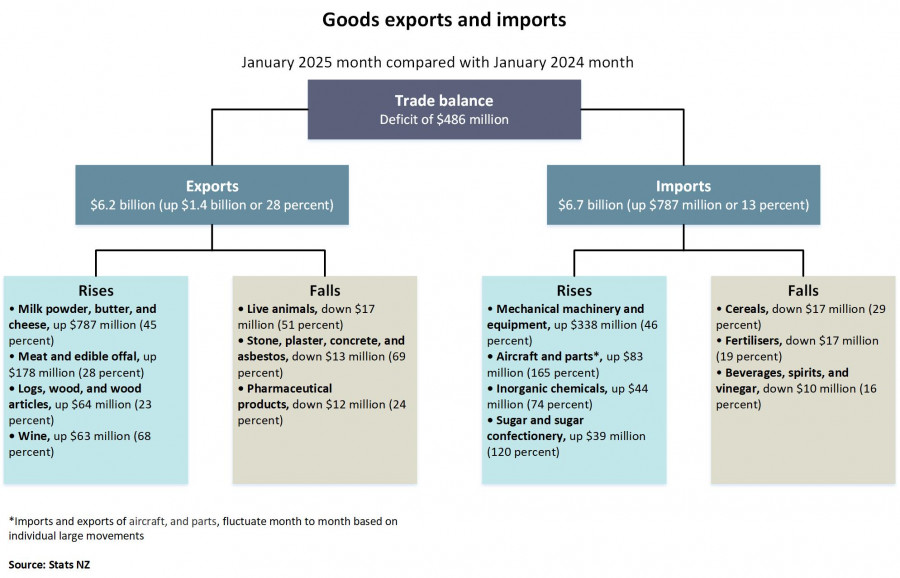
Text alternative for Goods exports and imports, January 2025 month compared with January 2024 month
The diagram shows Goods exports and imports for the January 2025 month compared with the January 2024 month.
The trade balance is a deficit of $486 million. This is the difference between exports valued at $6.2 billion (up $1.4 billion or 28 percent) and imports valued at $6.7 billion (up $787 million or 13 percent).
Export commodities that rose included: milk powder, butter and cheese, up $787 million (45 percent); meat and edible offal, up $178 million (28 percent); logs, wood, and wood articles, up $64 million (23 percent); and wine, up $63 million (68 percent).
Export commodities that fell included: live animals, down $17 million (51 percent); stone, plaster, concrete, and asbestos, down $13 million (69 percent); pharmaceutical products, down $12 million (24 percent).
Import commodities that rose included: mechanical machinery and equipment, up $338 million (46 percent); aircraft and parts, up $83 million (165 percent); inorganic chemicals, up $44 million (74 percent); sugars and sugar confectionery, up $39 million (120 percent).
Import commodities that fell included: cereals, down $17 million (29 percent); fertilisers, down $17 million (19 percent); beverages, spirits, and vinegar, down $10 million (16 percent).
*Exports and imports of aircraft, and parts fluctuate month to month based on individual large movements
Source: Stats NZ
More data
Use Infoshare to access time-series data for imports and exports.
Subject category: Imports and exports
Overseas merchandise trade datasets has CSV data for goods imports and exports.
International trade: December 2024 quarter has information on trade in goods and services.
Definitions and metadata
Overseas merchandise trade - DataInfo+ provides the definitions of terms used in this release and general methodology used to produce overseas merchandise trade statistics.
Technical enquiries
Hamidreza Bizhanyar
04 931 4600
[email protected]
ISSN 1178-0320
Next release
Overseas merchandise trade: February 2025 will be released on 21 March 2025.


