Overseas merchandise trade statistics provide information on imports and exports of merchandise goods between New Zealand and other countries.
Key facts
This release refers to trade in goods only.
In February 2025, compared with February 2024:
- goods exports rose by $954 million (16 percent), to $6.7 billion
- goods imports rose by $125 million (2.1 percent), to $6.2 billion
- the monthly trade balance was a surplus of $510 million.
| Year | Exports | Imports |
| 2005 | 2648296614 | 2754314096 |
| 2006 | 2595135137 | 2968944755 |
| 2007 | 2847306905 | 2974750351 |
| 2008 | 3698939543 | 3456249276 |
| 2009 | 3441554562 | 2959029667 |
| 2010 | 3319987179 | 2992155036 |
| 2011 | 3860067650 | 3676230205 |
| 2012 | 3617968870 | 3407395514 |
| 2013 | 3893052249 | 3460754971 |
| 2014 | 4531450064 | 3734368381 |
| 2015 | 3887048559 | 3803076917 |
| 2016 | 4237195041 | 3870269730 |
| 2017 | 4014518142 | 4056794611 |
| 2018 | 4444689404 | 4256432858 |
| 2019 | 4708285499 | 4801869636 |
| 2020 | 4888459478 | 4337820171 |
| 2021 | 4746223785 | 4296376775 |
| 2022 | 5190196779 | 5904997936 |
| 2023 | 5066418005 | 5913175635 |
| 2024 | 5784622173 | 6103611320 |
| 2025 | 6738985896 | 6228741843 |
Exports
Goods exports rose by $954 million (16 percent) in February 2025 (to $6.7 billion), compared with February 2024.
Milk powder, butter, and cheese lead exports rise
Milk powder, butter, and cheese rose $486 million (27 percent), to $2.3 billion.
February 2025 |
Change in |
Change in |
Change in |
Change in |
|
Milk powder, butter, |
2,255 |
486 | 27% | * |
* |
Milk powder |
1,148 | 181 | 19% | -5.7% | 26% |
Milk fats (including butter) |
531 | 202 | 61% | 16% | 40% |
Cheese |
325 | 121 | 59% | 38% | 15% |
Fresh milk and cream |
149 | 32 | 27% | * |
* |
* Changes in total quantity and unit price are omitted due to differences in units of measure. |
|||||
Other dairy-based products, including infant formula and casein and caseinates, rose during this period.
February 2025 |
Change in |
Change in |
Change in |
Change in |
|
Infant formula |
227 | 84 | 59% | 70% | -6.7% |
Casein and |
140 | 22 | 19% | 9.8% | 8.5% |
Infant formula is included in preparations of milk, cereals, flour, and starch, which rose $114 million (61 percent), to $303 million.
Meat and edible offal rose $227 million (28 percent), to $1.0 billion.
February 2025 value ($ million) |
Change in value ($ million) |
value |
Change in quantity |
Change in unit price |
|
Meat and |
1,028 |
227 |
28% |
-0.6% |
29% |
Frozen beef |
417 |
80 |
24% |
-4.8% |
30% |
Sheep meat |
473 |
123 |
35% |
3.9% |
30% |
Chilled beef |
70 |
12 |
21% |
-5.1% |
28% |
Top monthly export movements by country
The monthly movements in February 2025, compared with February 2024, for our top export partners (in order of total annual goods exports) were:
- China: total exports were up $249 million (16 percent).
- The largest rises were milk powder, butter, and cheese, up $188 million; preparations of milk, cereals, flour, and starch, up $54 million; and casein and caseinates, up $37 million.
- The largest falls were logs, wood, and wood articles, down $45 million; and fish, crustaceans, and molluscs, down $25 million.
- USA: total exports were down $46 million (5.5 percent).
- The largest rise was meat and edible offal, up $92 million.
- The largest falls were milk powder, butter, and cheese, down $71 million; casein and caseinates, down $26 million; and mechanical machinery and equipment, down $18 million.
- Australia: total exports were up $125 million (17 percent).
- The largest rises were crude oil, up $71 million; precious metals, jewellery, and coins, up $48 million; and pharmaceutical products, up $20 million.
- The largest falls were aircraft and parts, down $53 million; and live animals, down $10 million.
- EU: total exports were up $113 million (37 percent).
- The largest rises were meat and edible offal, up $78 million; aluminium and aluminium articles, up $20 million; and fish, crustaceans, and molluscs, up $10 million.
- There were no significant falls over $10 million.
- Japan: total exports were up $21 million (7.4 percent).
- The largest rise was milk powder, butter, and cheese, up $33 million.
- There were no significant falls over $10 million.
Imports
Goods imports rose by $125 million (2.1 percent) in February 2025 (to $6.2 billion), compared with February 2024.
Mechanical machinery and equipment lead imports rise
Mechanical machinery and equipment increased by $160 million (21 percent), reaching a total of $921 million. The primary drivers of this growth were turbo-jets and turbo-propellers, which significantly increased by $138 million (119 percent) to $254 million, and computers, which rose by $48 million (55 percent) to $134 million.
Vehicles, parts, and accessories fell by $152 million (19 percent) to $653 million. Leading the fall were vehicles for transport of goods, down $90 million (40 percent), and passenger motor cars, down $57 million (13 percent).
Top monthly import movements by country
The monthly movements in February 2025 compared with February 2024 for our top import partners (in order of total annual goods imports) were:
- China: total imports were up $49 million (3.8 percent).
- The largest rises were mechanical machinery and equipment, up $44 million; vehicles, parts, and accessories, up $22 million; and textiles and textile articles, up $16 million.
- The largest fall was electrical machinery and equipment, down $42 million.
- EU: total imports were down $29 million (3.3 percent).
- The largest rises were pharmaceutical products, up $12 million, and animal or vegetable fats and oils, up $11 million.
- The largest fall was vehicles, parts, and accessories, down $74 million.
- Australia: total imports were down $69 million (9.3 percent).
- The largest rises were cereals, up $15 million, and inorganic chemicals, also up $15 million.
- The largest falls were pharmaceutical products, down $43 million; sugars and sugar confectionery, down $35 million; and vehicles, parts, and accessories, down $13 million.
- USA: total imports were up $185 million (41 percent).
- The largest rises were mechanical machinery and equipment, up $117 million; aircraft and parts, up $50 million; and petroleum and products, up $18 million.
- There were no significant falls over $10 million.
- South Korea: total imports were down $337 million (57 percent).
- There were no significant rises over $10 million.
- The largest fall was petroleum and products, down $347 million.
Trade surplus in February 2025
The monthly trade balance was a surplus of $510 million.
| Month | Balance |
| Feb-16 | 366925311 |
| Mar-16 | 188849850 |
| Apr-16 | 349530073 |
| May-16 | 343078843 |
| Jun-16 | 106790388 |
| Jul-16 | -351427805 |
| Aug-16 | -1239891851 |
| Sep-16 | -1387987389 |
| Oct-16 | -797651150 |
| Nov-16 | -723201112 |
| Dec-16 | -1435171 |
| Jan-17 | -226543047 |
| Feb-17 | -42276469 |
| Mar-17 | 261589138 |
| Apr-17 | 546879922 |
| May-17 | 62020162 |
| Jun-17 | 243117487 |
| Jul-17 | 92027349 |
| Aug-17 | -1174342582 |
| Sep-17 | -1165209854 |
| Oct-17 | -839633458 |
| Nov-17 | -1222417301 |
| Dec-17 | 614310559 |
| Jan-18 | -662421494 |
| Feb-18 | 188256546 |
| Mar-18 | -150609406 |
| Apr-18 | 199745211 |
| May-18 | 199288004 |
| Jun-18 | -285260079 |
| Jul-18 | -203110333 |
| Aug-18 | -1566757996 |
| Sep-18 | -1579921712 |
| Oct-18 | -1305105133 |
| Nov-18 | -1003973060 |
| Dec-18 | 9286883 |
| Jan-19 | -934926531 |
| Feb-19 | -93584137 |
| Mar-19 | 825181314 |
| Apr-19 | 360963002 |
| May-19 | 174927698 |
| Jun-19 | 329812747 |
| Jul-19 | -732335397 |
| Aug-19 | -1641634097 |
| Sep-19 | -1309937148 |
| Oct-19 | -1038380593 |
| Nov-19 | -786493088 |
| Dec-19 | 379772255 |
| Jan-20 | -395635011 |
| Feb-20 | 550639307 |
| Mar-20 | 522807892 |
| Apr-20 | 1374019783 |
| May-20 | 1222702687 |
| Jun-20 | 416538602 |
| Jul-20 | 387761796 |
| Aug-20 | -320606284 |
| Sep-20 | -1132334429 |
| Oct-20 | -465913506 |
| Nov-20 | 679104 |
| Dec-20 | 230069561 |
| Jan-21 | -729765438 |
| Feb-21 | 449847010 |
| Mar-21 | -182555509 |
| Apr-21 | 557914991 |
| May-21 | 404936125 |
| Jun-21 | 442108253 |
| Jul-21 | -387158502 |
| Aug-21 | -2132508281 |
| Sep-21 | -2166033786 |
| Oct-21 | -1282573004 |
| Nov-21 | -1085761728 |
| Dec-21 | -990246456 |
| Jan-22 | -1106744295 |
| Feb-22 | -714801157 |
| Mar-22 | -593488596 |
| Apr-22 | 469495559.5 |
| May-22 | 148263036 |
| Jun-22 | -1132868318 |
| Jul-22 | -1415192071 |
| Aug-22 | -2634137110 |
| Sep-22 | -2519671472 |
| Oct-22 | -2315527621 |
| Nov-22 | -2183787239 |
| Dec-22 | -650530508 |
| Jan-23 | -2095237898 |
| Feb-23 | -846757630 |
| Mar-23 | -1602490156 |
| Apr-23 | 220854073 |
| May-23 | 41615990.2 |
| Jun-23 | -114738381 |
| Jul-23 | -1174149043 |
| Aug-23 | -2266681329 |
| Sep-23 | -2420838856 |
| Oct-23 | -1732504563 |
| Nov-23 | -1258971689 |
| Dec-23 | -372771305 |
| Jan-24 | -1064170538 |
| Feb-24 | -318989147 |
| Mar-24 | 469883412 |
| Apr-24 | -11882445 |
| May-24 | 59494662 |
| Jun-24 | 577124190 |
| Jul-24 | -1021575122 |
| Aug-24 | -2316015330 |
| Sep-24 | -2166468080 |
| Oct-24 | -1653634248 |
| Nov-24 | -449804544 |
| Dec-24 | 33627800 |
| Jan-25 | -544231796 |
| Feb-25 | 510244053 |
February 2025 year
Annual values are actual and compared with the year ended February 2024.
- Annual goods exports were valued at $73.0 billion, up $4.1 billion from the previous year.
- Annual goods imports were valued at $79.5 billion, down $1.4 billion from the previous year.
- The annual trade deficit was $6.5 billion. In the year ended February 2024 the deficit was $12.1 billion.
| Month | Trade balance |
| Feb-16 | -3293445747 |
| Mar-16 | -3765397257 |
| Apr-16 | -3599939057 |
| May-16 | -3624030736 |
| Jun-16 | -3335288185 |
| Jul-16 | -2956272033 |
| Aug-16 | -3105993844 |
| Sep-16 | -3353967015 |
| Oct-16 | -3246795580 |
| Nov-16 | -3174570464 |
| Dec-16 | -3134099782 |
| Jan-17 | -3372963060 |
| Feb-17 | -3782164840 |
| Mar-17 | -3709425552 |
| Apr-17 | -3512075703 |
| May-17 | -3793134384 |
| Jun-17 | -3656807285 |
| Jul-17 | -3213352131 |
| Aug-17 | -3147802862 |
| Sep-17 | -2925025327 |
| Oct-17 | -2967007635 |
| Nov-17 | -3466223824 |
| Dec-17 | -2850478094 |
| Jan-18 | -3286356541 |
| Feb-18 | -3055823526 |
| Mar-18 | -3468022070 |
| Apr-18 | -3815156781 |
| May-18 | -3677888939 |
| Jun-18 | -4206266505 |
| Jul-18 | -4501404187 |
| Aug-18 | -4893819601 |
| Sep-18 | -5308531459 |
| Oct-18 | -5774003134 |
| Nov-18 | -5555558893 |
| Dec-18 | -6160582569 |
| Jan-19 | -6433087606 |
| Feb-19 | -6714928289 |
| Mar-19 | -5739137569 |
| Apr-19 | -5577919778 |
| May-19 | -5602280084 |
| Jun-19 | -4987207258 |
| Jul-19 | -5516432322 |
| Aug-19 | -5591308423 |
| Sep-19 | -5321323859 |
| Oct-19 | -5054599319 |
| Nov-19 | -4837119347 |
| Dec-19 | -4466633975 |
| Jan-20 | -3927342455 |
| Feb-20 | -3283119011 |
| Mar-20 | -3585492433 |
| Apr-20 | -2572435652 |
| May-20 | -1524660663 |
| Jun-20 | -1437934808 |
| Jul-20 | -317837615 |
| Aug-20 | 1003190198 |
| Sep-20 | 1180792917 |
| Oct-20 | 1753260004 |
| Nov-20 | 2540432196 |
| Dec-20 | 2390729502 |
| Jan-21 | 2056599075 |
| Feb-21 | 1955806778 |
| Mar-21 | 1250443377 |
| Apr-21 | 434338585 |
| May-21 | -383427977 |
| Jun-21 | -357858326 |
| Jul-21 | -1132778624 |
| Aug-21 | -2944680621 |
| Sep-21 | -3978379978 |
| Oct-21 | -4795039476 |
| Nov-21 | -5881480308 |
| Dec-21 | -7101796325 |
| Jan-22 | -7478775182 |
| Feb-22 | -8643423349 |
| Mar-22 | -9054356436 |
| Apr-22 | -9142775867 |
| May-22 | -9399448956 |
| Jun-22 | -10974425528 |
| Jul-22 | -12002459097 |
| Aug-22 | -12504087926 |
| Sep-22 | -12857725612 |
| Oct-22 | -13890680229 |
| Nov-22 | -14988705740 |
| Dec-22 | -14648989792 |
| Jan-23 | -15637483395 |
| Feb-23 | -15769439868 |
| Mar-23 | -16778441428 |
| Apr-23 | -17027082914 |
| May-23 | -17133729960 |
| Jun-23 | -16115600023 |
| Jul-23 | -15874556995 |
| Aug-23 | -15507101214 |
| Sep-23 | -15408268598 |
| Oct-23 | -14825245540 |
| Nov-23 | -13900429990 |
| Dec-23 | -13622670787 |
| Jan-24 | -12591603427 |
| Feb-24 | -12063834944 |
| Mar-24 | -9991461376 |
| Apr-24 | -10224197894 |
| May-24 | -10206319222 |
| Jun-24 | -9514456651 |
| Jul-24 | -9361882730 |
| Aug-24 | -9411216731 |
| Sep-24 | -9156845955 |
| Oct-24 | -9077975640 |
| Nov-24 | -8268808495 |
| Dec-24 | -7862409390 |
| Jan-25 | -7342470648 |
| Feb-25 | -6513237448 |
| Month | Exports | Imports |
| Feb-16 | 49537612567 | 52831058314 |
| Mar-16 | 48833243763 | 52598641020 |
| Apr-16 | 49026536183 | 52626475240 |
| May-16 | 49230155446 | 52854186182 |
| Jun-16 | 49324864243 | 52660152428 |
| Jul-16 | 49121608220 | 52077880253 |
| Aug-16 | 48793893786 | 51899887630 |
| Sep-16 | 48583604241 | 51937571256 |
| Oct-16 | 48696300602 | 51943096182 |
| Nov-16 | 48493856234 | 51668426698 |
| Dec-16 | 48486904078 | 51621003860 |
| Jan-17 | 48527688853 | 51900651913 |
| Feb-17 | 48305011954 | 52087176794 |
| Mar-17 | 48694076739 | 52403502291 |
| Apr-17 | 49076148830 | 52588224533 |
| May-17 | 49424472301 | 53217606685 |
| Jun-17 | 49873491508 | 53530298793 |
| Jul-17 | 50528773127 | 53742125258 |
| Aug-17 | 50834401328 | 53982204190 |
| Sep-17 | 51160043929 | 54085069256 |
| Oct-17 | 51791672041 | 54758679676 |
| Nov-17 | 52532859588 | 55999083412 |
| Dec-17 | 53625488161 | 56475966255 |
| Jan-18 | 53965184420 | 57251540961 |
| Feb-18 | 54395355682 | 57451179208 |
| Mar-18 | 54602966051 | 58070988121 |
| Apr-18 | 54860205151 | 58675361932 |
| May-18 | 55304076433 | 58981965372 |
| Jun-18 | 55490192916 | 59696459421 |
| Jul-18 | 56206201587 | 60707605774 |
| Aug-18 | 56493336022 | 61387155623 |
| Sep-18 | 56954044261 | 62262575720 |
| Oct-18 | 57226558637 | 63000561771 |
| Nov-18 | 57470599037 | 63026157930 |
| Dec-18 | 57251104265 | 63411686834 |
| Jan-19 | 57320341207 | 63753428813 |
| Feb-19 | 57583937302 | 64298865591 |
| Mar-19 | 58386241764 | 64125379333 |
| Apr-19 | 58900924296 | 64478844074 |
| May-19 | 59293597157 | 64895877241 |
| Jun-19 | 59378412551 | 64365619809 |
| Jul-19 | 58963308257 | 64479740579 |
| Aug-19 | 59050318141 | 64641626564 |
| Sep-19 | 59153331446 | 64474655305 |
| Oct-19 | 59330562863 | 64385162182 |
| Nov-19 | 59689705163 | 64526824510 |
| Dec-19 | 59899236281 | 64365870256 |
| Jan-20 | 60232430772 | 64159773227 |
| Feb-20 | 60412604751 | 63695723762 |
| Mar-20 | 60424643728 | 64010136161 |
| Apr-20 | 60267881085 | 62840316737 |
| May-20 | 59860029862 | 61384690525 |
| Jun-20 | 59923371349 | 61361306157 |
| Jul-20 | 59958852127 | 60276689742 |
| Aug-20 | 60267415950 | 59264225752 |
| Sep-20 | 59811824505 | 58631031588 |
| Oct-20 | 59608519266 | 57855259262 |
| Nov-20 | 59310670094 | 56770237898 |
| Dec-20 | 59352090268 | 56961360766 |
| Jan-21 | 58791158732 | 56734559657 |
| Feb-21 | 58648923039 | 56693116261 |
| Mar-21 | 58509007529 | 57258564152 |
| Apr-21 | 58727983912 | 58293645327 |
| May-21 | 59187764622 | 59571192599 |
| Jun-21 | 60317064345 | 60674922671 |
| Jul-21 | 61137731227 | 62270509851 |
| Aug-21 | 61130377632 | 64075058253 |
| Sep-21 | 61626437404 | 65604817382 |
| Oct-21 | 62203301840 | 66998341316 |
| Nov-21 | 62957144846 | 68838625154 |
| Dec-21 | 63494172023 | 70595968348 |
| Jan-22 | 64179336420 | 71658111602 |
| Feb-22 | 64623309414 | 73266732763 |
| Mar-22 | 65620086364 | 74674442800 |
| Apr-22 | 66238532811 | 75381308679 |
| May-22 | 67249624549 | 76649073506 |
| Jun-22 | 67320451696 | 78294877224 |
| Jul-22 | 67880911372 | 79883370469 |
| Aug-22 | 68799762323 | 81303850249 |
| Sep-22 | 70313919973 | 83171645585 |
| Oct-22 | 70886872314 | 84777552543 |
| Nov-22 | 71544229919 | 86532935659 |
| Dec-22 | 71970611821 | 86619601613 |
| Jan-23 | 72476808672 | 88114292067 |
| Feb-23 | 72353029898 | 88122469766 |
| Mar-23 | 72141630258 | 88920071686 |
| Apr-23 | 72569483052 | 89596565966 |
| May-23 | 72717557731 | 89851287691 |
| Jun-23 | 72672011431 | 88787611454 |
| Jul-23 | 71711512987 | 87586069982 |
| Aug-23 | 71402878992 | 86909980206 |
| Sep-23 | 70258409955 | 85666678553 |
| Oct-23 | 69672337565 | 84497583105 |
| Nov-23 | 69280620301 | 83181050291 |
| Dec-23 | 68620962133 | 82243632920 |
| Jan-24 | 68136465013 | 80728068440 |
| Feb-24 | 68854669181 | 80918504125 |
| Mar-24 | 68969169693 | 78960631069 |
| Apr-24 | 68673149211 | 78897347105 |
| May-24 | 68719391678 | 78925710900 |
| Jun-24 | 68567972772 | 78082429423 |
| Jul-24 | 69269795361 | 78631678091 |
| Aug-24 | 69130797935 | 78542014666 |
| Sep-24 | 69260320778 | 78417166733 |
| Oct-24 | 69512025393 | 78590001033 |
| Nov-24 | 69976656237 | 78245464732 |
| Dec-24 | 70796868943 | 78659278333 |
| Jan-25 | 72033553261 | 79376023909 |
| Feb-25 | 72987916984 | 79501154432 |
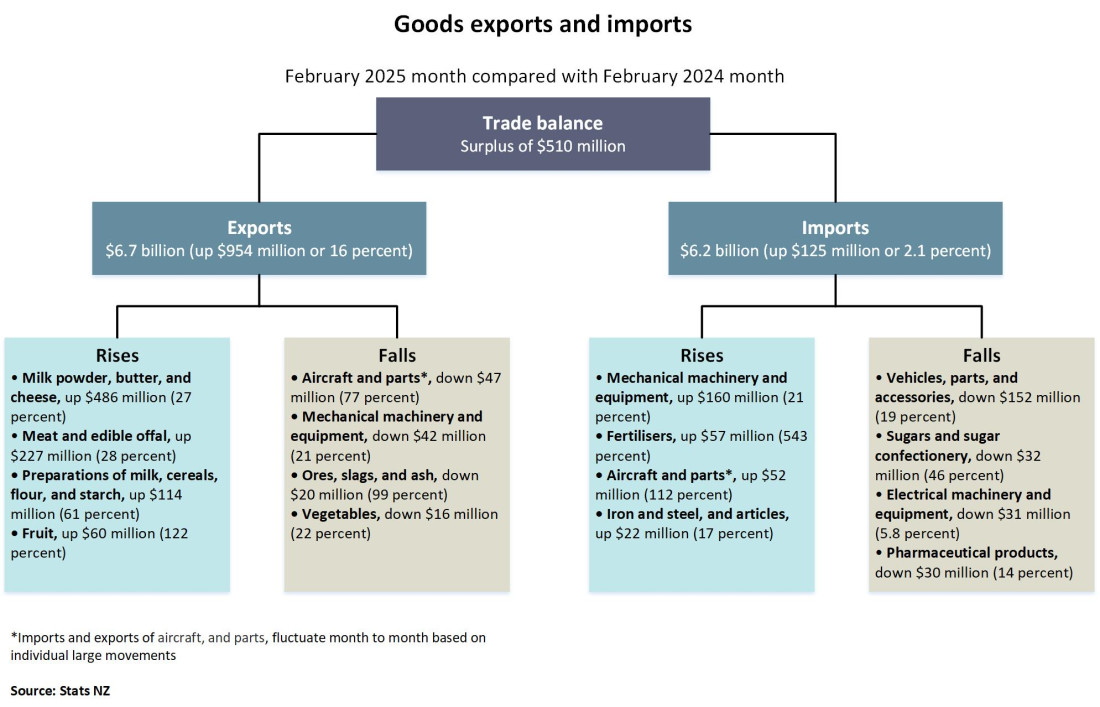
Text alternative for Goods exports and imports, February 2025 month compared with February 2024 month
The diagram shows goods exports and imports for the February 2025 month compared with the February 2024 month.
The trade balance is a surplus of $510 million. This is the difference between exports valued at $6.7 billion (up $954 million or 16 percent) and imports valued at $6.2 billion (up $125 million or 2.1 percent).
Export commodities that rose included: milk powder, butter, and cheese, up $486 million (27 percent); meat and edible offal, up $227 million (28 percent); preparations of milk, cereals, flour, and starch, up $114 million (61 percent); and fruit, up $60 million (122 percent).
Export commodities that fell included: aircraft and parts, down $47 million (77 percent); mechanical machinery and equipment, down $42 million (21 percent); ores, slags, and ash, down $20 million (99 percent); and vegetables, down $16 million (22 percent).
Import commodities that rose included: mechanical machinery and equipment, up $160 million (21 percent); fertilisers, up $57 million (543 percent); aircraft and parts*, up $52 million (112 percent); and iron and steel, and articles, up $22 million (17 percent).
Import commodities that fell included: vehicles, parts, and accessories, down $152 million (19 percent); sugars and sugar confectionery, down $32 million (46 percent); electrical machinery and equipment, down $31 million (5.8 percent); and pharmaceutical products, down $30 million (14 percent).
*Exports and imports of aircraft and parts fluctuate month to month based on individual large movements.
Source: Stats NZ
More data
Use Infoshare to access time-series data for imports and exports.
Subject category: Imports and exports
Overseas merchandise trade datasets has CSV data for goods imports and exports.
International trade: December 2024 quarter has information on trade in goods and services.
Definitions and metadata
Overseas merchandise trade - DataInfo+ provides the definitions of terms used in this release and general methodology used to produce overseas merchandise trade statistics.
Technical enquiries
Samisoni Makaafi
04 931 4600
[email protected]
ISSN 1178-0320
Next release
Overseas merchandise trade: March 2025 will be released on 22 April 2025.


