Overseas merchandise trade statistics provide information on imports and exports of merchandise goods between New Zealand and other countries.
Key facts
This release refers to trade in goods only.
In August 2024, compared with August 2023:
- goods exports fell by $6.1 million (0.1 percent), to $5.0 billion
- goods imports fell by $70 million (1.0 percent), to $7.2 billion
- the monthly trade balance was a deficit of $2.2 billion.
| Year | Exports | Imports |
| 2004 | 2365641755 | 3073857725 |
| 2005 | 2360914116 | 3461763056 |
| 2006 | 2732836836 | 3684201080 |
| 2007 | 2660825914 | 3607963161 |
| 2008 | 3574762714 | 4422529659 |
| 2009 | 2744878422 | 3461494300 |
| 2010 | 3129838208 | 3560266864 |
| 2011 | 3431408060 | 4121855656 |
| 2012 | 3309456770 | 4121005537 |
| 2013 | 3296464103 | 4532069390 |
| 2014 | 3533309300 | 3997845876 |
| 2015 | 3710311790 | 4800481830 |
| 2016 | 3382597356 | 4622489207 |
| 2017 | 3688225557 | 4862568139 |
| 2018 | 3975359992 | 5542117988 |
| 2019 | 4062369876 | 5704003973 |
| 2020 | 4370933699 | 4691539983 |
| 2021 | 4363580104 | 6496088385 |
| 2022 | 5282431055 | 7916568165 |
| 2023 | 4973797060 | 7240478389 |
| 2024 | 4967701676 | 7170759854 |
Text alternative for Goods exports and imports, August 2024 month compared with August 2023 month
Exports
Goods exports fell by $6.1 million (0.1 percent) in August 2024 (to $5.0 billion), compared with August 2023.
Meat and edible offal lead exports fall
Meat and edible offal, fell $119 million (19 percent), to $497 million. Sheep meat fell $64 million (27 percent), to $170 million, and beef fell $51 million (15 percent), to $286 million.
Milk powder, butter, and cheese fell $79 million (8.1 percent), to $885 billion.
August 2024 value |
Change in value |
Change in value |
Change |
Change in |
|
Milk powder, butter, |
885 |
-79 |
-8.1% |
* |
* |
Milk powder |
308 |
-24 |
-7.3% |
-14% |
7.3% |
Milk fats (including butter) |
227 |
2.8 |
1.3% |
-21% |
27% |
Cheese |
166 |
-6.9 |
-4.0% |
0.5% |
-4.5% |
Fresh milk and cream |
117 |
-26 |
-18% |
* |
* |
* Changes in total quantity and unit price are omitted due to differences in units of measure. |
|||||
Other dairy-based products, including infant formula rose this period, and casein and caseinates fell during this period.
August 2024 value |
Change in value |
Change |
Change |
Change |
|
Infant formula |
139 |
15 |
12% |
36% |
-18% |
Casein and caseinates |
42 |
-49 |
-54% |
-43% |
-18% |
Infant formula is included in preparations of milk, cereals, flour, and starch, which rose $3.8 million (2.0 percent), to $190 million.
Fruit, up $203 million (53 percent), to $590 million. This was led by kiwifruit, which rose $177 million (58 percent), to $485 million.
| Year | Value |
| 2015 | 1186634266 |
| 2016 | 1352247852 |
| 2017 | 1451424480 |
| 2018 | 1668333009 |
| 2019 | 1878028581 |
| 2020 | 2286876962 |
| 2021 | 2263530259 |
| 2022 | 2254428209 |
| 2023 | 2213388652 |
| 2024 | 2930137351 |
Top monthly export movements by country
The monthly movements in August 2024, compared with August 2023, for our top export partners (in order of total annual goods exports) were:
- China: total exports were down $195 million (16 percent).
- The largest rises were fruit, up $62 million and crude oil, up $35 million.
- The largest falls were milk powder, butter, and cheese, down $94 million; meat and edible offal, down $90 million; and logs, wood and wood articles, down $36 million.
- Australia: total exports were up $16 million (2.2 percent).
- The largest rise was mechanical machinery and equipment, up $11 million.
- The largest fall was iron and steel, and articles, down $14 million.
- USA: total exports were up $22 million (3.1 percent).
- The largest rises were electrical machinery and equipment, up $15 million; iron and steel, and articles, up $12 million; and meat and edible offal, up $12 million.
- The largest falls were milk powder, butter, and cheese, down $23 million; wine, down $17 million; and animal and vegetable fats and oils, down $14 million.
- EU: total exports were up $23 million (5.9 percent).
- The largest rise was fruit, up $48 million.
- The largest fall was aluminium and aluminium articles, down $14 million.
- Japan: total exports were up $102 million (39 percent).
- The largest rises were fruit, up $59 million; and milk powder, butter, and cheese, up $23 million.
- There were no significant falls over $10 million.
Imports
Goods imports fell by $70 million (1.0 percent), in August 2024 (to $7.2 billion), compared with August 2023.
Vehicles, parts, and accessories lead the fall in imports
Vehicles, parts, and accessories fell $478 million (42 percent), to $669 million. This was led by passenger cars that fell $367 million (51 percent), to $354 million, which was in turn led by electric passenger cars that fell $95 million (88 percent), to $13 million.
| Month | Value |
| Jan-19 | 437069323 |
| Feb-19 | 350235873 |
| Mar-19 | 400051979 |
| Apr-19 | 365677481 |
| May-19 | 405402301 |
| Jun-19 | 390506459 |
| Jul-19 | 442382182 |
| Aug-19 | 432566856 |
| Sep-19 | 477044757 |
| Oct-19 | 371590169 |
| Nov-19 | 434214824 |
| Dec-19 | 408073109 |
| Jan-20 | 330433734 |
| Feb-20 | 321544409 |
| Mar-20 | 428319688 |
| Apr-20 | 246829003 |
| May-20 | 161038880 |
| Jun-20 | 201115313 |
| Jul-20 | 208651973 |
| Aug-20 | 299853381 |
| Sep-20 | 366863586 |
| Oct-20 | 388458044 |
| Nov-20 | 352271102 |
| Dec-20 | 448075000 |
| Jan-21 | 390310243 |
| Feb-21 | 443431719 |
| Mar-21 | 527053069 |
| Apr-21 | 435970196 |
| May-21 | 564501111 |
| Jun-21 | 554734717 |
| Jul-21 | 525126599 |
| Aug-21 | 566360616 |
| Sep-21 | 507207414 |
| Oct-21 | 534367935 |
| Nov-21 | 439609373 |
| Dec-21 | 552280172 |
| Jan-22 | 356198676 |
| Feb-22 | 491544594 |
| Mar-22 | 545291666 |
| Apr-22 | 473896810 |
| May-22 | 559490883 |
| Jun-22 | 522635733 |
| Jul-22 | 617305260 |
| Aug-22 | 545024753 |
| Sep-22 | 612060451 |
| Oct-22 | 706425005 |
| Nov-22 | 716646341 |
| Dec-22 | 602280019 |
| Jan-23 | 406283962 |
| Feb-23 | 522026326 |
| Mar-23 | 573207139 |
| Apr-23 | 482704919 |
| May-23 | 588306609 |
| Jun-23 | 627954459 |
| Jul-23 | 621311601 |
| Aug-23 | 721754471 |
| Sep-23 | 662007898 |
| Oct-23 | 640907191 |
| Nov-23 | 534113277 |
| Dec-23 | 514453419 |
| Jan-24 | 368707867 |
| Feb-24 | 445385206 |
| Mar-24 | 467707176 |
| Apr-24 | 414561633 |
| May-24 | 473763812 |
| Jun-24 | 487579862 |
| Jul-24 | 454432294 |
| Aug-24 | 354557365 |
Top monthly import movements by country
The monthly movements in August 2024, compared with August 2023, for our top import partners (in order of total annual goods imports) were:
- China: total imports were down $101 million (6.4 percent).
- The largest rise was fertilisers, up $14 million.
- The largest falls were electrical machinery and equipment, down $54 million; mechanical machinery and equipment, down $34 million; and petroleum and products, down $34 million.
- EU: total imports were down $91 million (8.2 percent).
- The largest rises were ships, boats, and floating structures, up $31 million; and aircraft and parts, up $16 million.
- The largest falls were vehicles, parts, and accessories, down $112 million; and mechanical machinery and equipment, down $32 million.
- Australia: total imports were down $100 million (12 percent).
- The largest rise was inorganic chemicals, up $12 million.
- The largest falls were vehicles, parts, and accessories, down $47 million; and cereals, down $24 million.
- USA: total imports were up $154 million (24 percent).
- The largest rises were aircraft and parts, up $185 million; food residues, wastes, and fodder, up $12 million; and optical, medical, and measuring equipment, up $10 million.
- The largest falls were vehicles, parts, and accessories, down $45 million; and mechanical machinery and equipment, down $23 million.
- South Korea: total imports were up $185 million (39 percent).
- The largest rises were petroleum and products, up $173 million; and fertilisers, up $29 million.
- The largest fall was vehicles, parts, and accessories, down $19 million.
Trade deficit in August 2024
The monthly trade balance was a deficit of $2.2 billion.
| Month | Trade balance |
| Aug-15 | -1090170040 |
| Sep-15 | -1140014218 |
| Oct-15 | -904822585 |
| Nov-15 | -795426228 |
| Dec-15 | -41905853 |
| Jan-16 | 12320231 |
| Feb-16 | 366925311 |
| Mar-16 | 188849850 |
| Apr-16 | 349530073 |
| May-16 | 343078843 |
| Jun-16 | 106790388 |
| Jul-16 | -351427805 |
| Aug-16 | -1239891851 |
| Sep-16 | -1387987389 |
| Oct-16 | -797651150 |
| Nov-16 | -723201112 |
| Dec-16 | -1435171 |
| Jan-17 | -226543047 |
| Feb-17 | -42276469 |
| Mar-17 | 261589138 |
| Apr-17 | 546879922 |
| May-17 | 62020162 |
| Jun-17 | 243117487 |
| Jul-17 | 92027349 |
| Aug-17 | -1174342582 |
| Sep-17 | -1165209854 |
| Oct-17 | -839633458 |
| Nov-17 | -1222417301 |
| Dec-17 | 614310559 |
| Jan-18 | -662421494 |
| Feb-18 | 188256546 |
| Mar-18 | -150609406 |
| Apr-18 | 199745211 |
| May-18 | 199288004 |
| Jun-18 | -285260079 |
| Jul-18 | -203110333 |
| Aug-18 | -1566757996 |
| Sep-18 | -1579921712 |
| Oct-18 | -1305105133 |
| Nov-18 | -1003973060 |
| Dec-18 | 9286883 |
| Jan-19 | -934926531 |
| Feb-19 | -93584137 |
| Mar-19 | 825181314 |
| Apr-19 | 360963002 |
| May-19 | 174927698 |
| Jun-19 | 329812747 |
| Jul-19 | -732335397 |
| Aug-19 | -1641634097 |
| Sep-19 | -1309937148 |
| Oct-19 | -1038380593 |
| Nov-19 | -786493088 |
| Dec-19 | 379772255 |
| Jan-20 | -395635011 |
| Feb-20 | 550639307 |
| Mar-20 | 522807892 |
| Apr-20 | 1374019783 |
| May-20 | 1222702687 |
| Jun-20 | 416538602 |
| Jul-20 | 387761796 |
| Aug-20 | -320606284 |
| Sep-20 | -1132334429 |
| Oct-20 | -465913506 |
| Nov-20 | 679104 |
| Dec-20 | 230069561 |
| Jan-21 | -729765438 |
| Feb-21 | 449847010 |
| Mar-21 | -182555509 |
| Apr-21 | 557914991 |
| May-21 | 404936125 |
| Jun-21 | 442108253 |
| Jul-21 | -387158502 |
| Aug-21 | -2132508281 |
| Sep-21 | -2166033786 |
| Oct-21 | -1282573004 |
| Nov-21 | -1085761728 |
| Dec-21 | -990246456 |
| Jan-22 | -1106744295 |
| Feb-22 | -714801157 |
| Mar-22 | -593488596 |
| Apr-22 | 469495559.5 |
| May-22 | 148263036 |
| Jun-22 | -1132868318 |
| Jul-22 | -1415192071 |
| Aug-22 | -2634137110 |
| Sep-22 | -2519671472 |
| Oct-22 | -2315527621 |
| Nov-22 | -2183787239 |
| Dec-22 | -650530508 |
| Jan-23 | -2095237898 |
| Feb-23 | -846757630 |
| Mar-23 | -1602490156 |
| Apr-23 | 220854073 |
| May-23 | 41615990.2 |
| Jun-23 | -114738381 |
| Jul-23 | -1174149043 |
| Aug-23 | -2266681329 |
| Sep-23 | -2420838856 |
| Oct-23 | -1732504563 |
| Nov-23 | -1258971689 |
| Dec-23 | -372771305 |
| Jan-24 | -1064170538 |
| Feb-24 | -318989147 |
| Mar-24 | 469883412 |
| Apr-24 | -11882445 |
| May-24 | 59494662 |
| Jun-24 | 581146221 |
| Jul-24 | -1015650562 |
| Aug-24 | -2203058178 |
August 2024 year
Annual values are actual and compared with the year ended August 2023.
- Annual goods exports were valued at $69.3 billion, down $2.1 billion from the previous year.
- Annual goods imports were valued at $78.6 billion, down $8.3 billion from the previous year.
- The annual trade deficit was $9.3 billion. In the year ended August 2023, the annual trade deficit was $15.5 billion.
| Year | Trade balance |
| Aug-15 | -3388079713 |
| Sep-15 | -3169130897 |
| Oct-15 | -3182409618 |
| Nov-15 | -3694857477 |
| Dec-15 | -3536562994 |
| Jan-16 | -3576399416 |
| Feb-16 | -3293445747 |
| Mar-16 | -3765397257 |
| Apr-16 | -3599939057 |
| May-16 | -3624030736 |
| Jun-16 | -3335288185 |
| Jul-16 | -2956272033 |
| Aug-16 | -3105993844 |
| Sep-16 | -3353967015 |
| Oct-16 | -3246795580 |
| Nov-16 | -3174570464 |
| Dec-16 | -3134099782 |
| Jan-17 | -3372963060 |
| Feb-17 | -3782164840 |
| Mar-17 | -3709425552 |
| Apr-17 | -3512075703 |
| May-17 | -3793134384 |
| Jun-17 | -3656807285 |
| Jul-17 | -3213352131 |
| Aug-17 | -3147802862 |
| Sep-17 | -2925025327 |
| Oct-17 | -2967007635 |
| Nov-17 | -3466223824 |
| Dec-17 | -2850478094 |
| Jan-18 | -3286356541 |
| Feb-18 | -3055823526 |
| Mar-18 | -3468022070 |
| Apr-18 | -3815156781 |
| May-18 | -3677888939 |
| Jun-18 | -4206266505 |
| Jul-18 | -4501404187 |
| Aug-18 | -4893819601 |
| Sep-18 | -5308531459 |
| Oct-18 | -5774003134 |
| Nov-18 | -5555558893 |
| Dec-18 | -6160582569 |
| Jan-19 | -6433087606 |
| Feb-19 | -6714928289 |
| Mar-19 | -5739137569 |
| Apr-19 | -5577919778 |
| May-19 | -5602280084 |
| Jun-19 | -4987207258 |
| Jul-19 | -5516432322 |
| Aug-19 | -5591308423 |
| Sep-19 | -5321323859 |
| Oct-19 | -5054599319 |
| Nov-19 | -4837119347 |
| Dec-19 | -4466633975 |
| Jan-20 | -3927342455 |
| Feb-20 | -3283119011 |
| Mar-20 | -3585492433 |
| Apr-20 | -2572435652 |
| May-20 | -1524660663 |
| Jun-20 | -1437934808 |
| Jul-20 | -317837615 |
| Aug-20 | 1003190198 |
| Sep-20 | 1180792917 |
| Oct-20 | 1753260004 |
| Nov-20 | 2540432196 |
| Dec-20 | 2390729502 |
| Jan-21 | 2056599075 |
| Feb-21 | 1955806778 |
| Mar-21 | 1250443377 |
| Apr-21 | 434338585 |
| May-21 | -383427977 |
| Jun-21 | -357858326 |
| Jul-21 | -1132778624 |
| Aug-21 | -2944680621 |
| Sep-21 | -3978379978 |
| Oct-21 | -4795039476 |
| Nov-21 | -5881480308 |
| Dec-21 | -7101796325 |
| Jan-22 | -7478775182 |
| Feb-22 | -8643423349 |
| Mar-22 | -9054356436 |
| Apr-22 | -9142775867 |
| May-22 | -9399448956 |
| Jun-22 | -10974425528 |
| Jul-22 | -12002459097 |
| Aug-22 | -12504087926 |
| Sep-22 | -12857725612 |
| Oct-22 | -13890680229 |
| Nov-22 | -14988705740 |
| Dec-22 | -14648989792 |
| Jan-23 | -15637483395 |
| Feb-23 | -15769439868 |
| Mar-23 | -16778441428 |
| Apr-23 | -17027082914 |
| May-23 | -17133729960 |
| Jun-23 | -16115600023 |
| Jul-23 | -15874556995 |
| Aug-23 | -15507101214 |
| Sep-23 | -15408268598 |
| Oct-23 | -14825245540 |
| Nov-23 | -13900429990 |
| Dec-23 | -13622670787 |
| Jan-24 | -12591603427 |
| Feb-24 | -12063834944 |
| Mar-24 | -9991461376 |
| Apr-24 | -10224197894 |
| May-24 | -10206319222 |
| Jun-24 | -9510434620 |
| Jul-24 | -9351936139 |
| Aug-24 | -9288312988 |
| Year | Exports | Imports |
| Aug-15 | 49057455495 | 52445535208 |
| Sep-15 | 49117987199 | 52287118096 |
| Oct-15 | 48918947187 | 52101356805 |
| Nov-15 | 48952719875 | 52647577352 |
| Dec-15 | 48973550776 | 52510113770 |
| Jan-16 | 49187466085 | 52763865501 |
| Feb-16 | 49537612567 | 52831058314 |
| Mar-16 | 48833243763 | 52598641020 |
| Apr-16 | 49026536183 | 52626475240 |
| May-16 | 49230155446 | 52854186182 |
| Jun-16 | 49324864243 | 52660152428 |
| Jul-16 | 49121608220 | 52077880253 |
| Aug-16 | 48793893786 | 51899887630 |
| Sep-16 | 48583604241 | 51937571256 |
| Oct-16 | 48696300602 | 51943096182 |
| Nov-16 | 48493856234 | 51668426698 |
| Dec-16 | 48486904078 | 51621003860 |
| Jan-17 | 48527688853 | 51900651913 |
| Feb-17 | 48305011954 | 52087176794 |
| Mar-17 | 48694076739 | 52403502291 |
| Apr-17 | 49076148830 | 52588224533 |
| May-17 | 49424472301 | 53217606685 |
| Jun-17 | 49873491508 | 53530298793 |
| Jul-17 | 50528773127 | 53742125258 |
| Aug-17 | 50834401328 | 53982204190 |
| Sep-17 | 51160043929 | 54085069256 |
| Oct-17 | 51791672041 | 54758679676 |
| Nov-17 | 52532859588 | 55999083412 |
| Dec-17 | 53625488161 | 56475966255 |
| Jan-18 | 53965184420 | 57251540961 |
| Feb-18 | 54395355682 | 57451179208 |
| Mar-18 | 54602966051 | 58070988121 |
| Apr-18 | 54860205151 | 58675361932 |
| May-18 | 55304076433 | 58981965372 |
| Jun-18 | 55490192916 | 59696459421 |
| Jul-18 | 56206201587 | 60707605774 |
| Aug-18 | 56493336022 | 61387155623 |
| Sep-18 | 56954044261 | 62262575720 |
| Oct-18 | 57226558637 | 63000561771 |
| Nov-18 | 57470599037 | 63026157930 |
| Dec-18 | 57251104265 | 63411686834 |
| Jan-19 | 57320341207 | 63753428813 |
| Feb-19 | 57583937302 | 64298865591 |
| Mar-19 | 58386241764 | 64125379333 |
| Apr-19 | 58900924296 | 64478844074 |
| May-19 | 59293597157 | 64895877241 |
| Jun-19 | 59378412551 | 64365619809 |
| Jul-19 | 58963308257 | 64479740579 |
| Aug-19 | 59050318141 | 64641626564 |
| Sep-19 | 59153331446 | 64474655305 |
| Oct-19 | 59330562863 | 64385162182 |
| Nov-19 | 59689705163 | 64526824510 |
| Dec-19 | 59899236281 | 64365870256 |
| Jan-20 | 60232430772 | 64159773227 |
| Feb-20 | 60412604751 | 63695723762 |
| Mar-20 | 60424643728 | 64010136161 |
| Apr-20 | 60267881085 | 62840316737 |
| May-20 | 59860029862 | 61384690525 |
| Jun-20 | 59923371349 | 61361306157 |
| Jul-20 | 59958852127 | 60276689742 |
| Aug-20 | 60267415950 | 59264225752 |
| Sep-20 | 59811824505 | 58631031588 |
| Oct-20 | 59608519266 | 57855259262 |
| Nov-20 | 59310670094 | 56770237898 |
| Dec-20 | 59352090268 | 56961360766 |
| Jan-21 | 58791158732 | 56734559657 |
| Feb-21 | 58648923039 | 56693116261 |
| Mar-21 | 58509007529 | 57258564152 |
| Apr-21 | 58727983912 | 58293645327 |
| May-21 | 59187764622 | 59571192599 |
| Jun-21 | 60317064345 | 60674922671 |
| Jul-21 | 61137731227 | 62270509851 |
| Aug-21 | 61130377632 | 64075058253 |
| Sep-21 | 61626437404 | 65604817382 |
| Oct-21 | 62203301840 | 66998341316 |
| Nov-21 | 62957144846 | 68838625154 |
| Dec-21 | 63494172023 | 70595968348 |
| Jan-22 | 64179336420 | 71658111602 |
| Feb-22 | 64623309414 | 73266732763 |
| Mar-22 | 65620086364 | 74674442800 |
| Apr-22 | 66238532811 | 75381308679 |
| May-22 | 67249624549 | 76649073506 |
| Jun-22 | 67320451696 | 78294877224 |
| Jul-22 | 67880911372 | 79883370469 |
| Aug-22 | 68799762323 | 81303850249 |
| Sep-22 | 70313919973 | 83171645585 |
| Oct-22 | 70886872314 | 84777552543 |
| Nov-22 | 71544229919 | 86532935659 |
| Dec-22 | 71970611821 | 86619601613 |
| Jan-23 | 72476808672 | 88114292067 |
| Feb-23 | 72353029898 | 88122469766 |
| Mar-23 | 72141630258 | 88920071686 |
| Apr-23 | 72569483052 | 89596565966 |
| May-23 | 72717557731 | 89851287691 |
| Jun-23 | 72672011431 | 88787611454 |
| Jul-23 | 71711512987 | 87586069982 |
| Aug-23 | 71402878992 | 86909980206 |
| Sep-23 | 70258409955 | 85666678553 |
| Oct-23 | 69672337565 | 84497583105 |
| Nov-23 | 69280620301 | 83181050291 |
| Dec-23 | 68620962133 | 82243632920 |
| Jan-24 | 68136465013 | 80728068440 |
| Feb-24 | 68854669181 | 80918504125 |
| Mar-24 | 68969169693 | 78960631069 |
| Apr-24 | 68673149211 | 78897347105 |
| May-24 | 68719391678 | 78925710900 |
| Jun-24 | 68572263517 | 78082698137 |
| Jul-24 | 69280487154 | 78632423293 |
| Aug-24 | 69274391770 | 78562704758 |
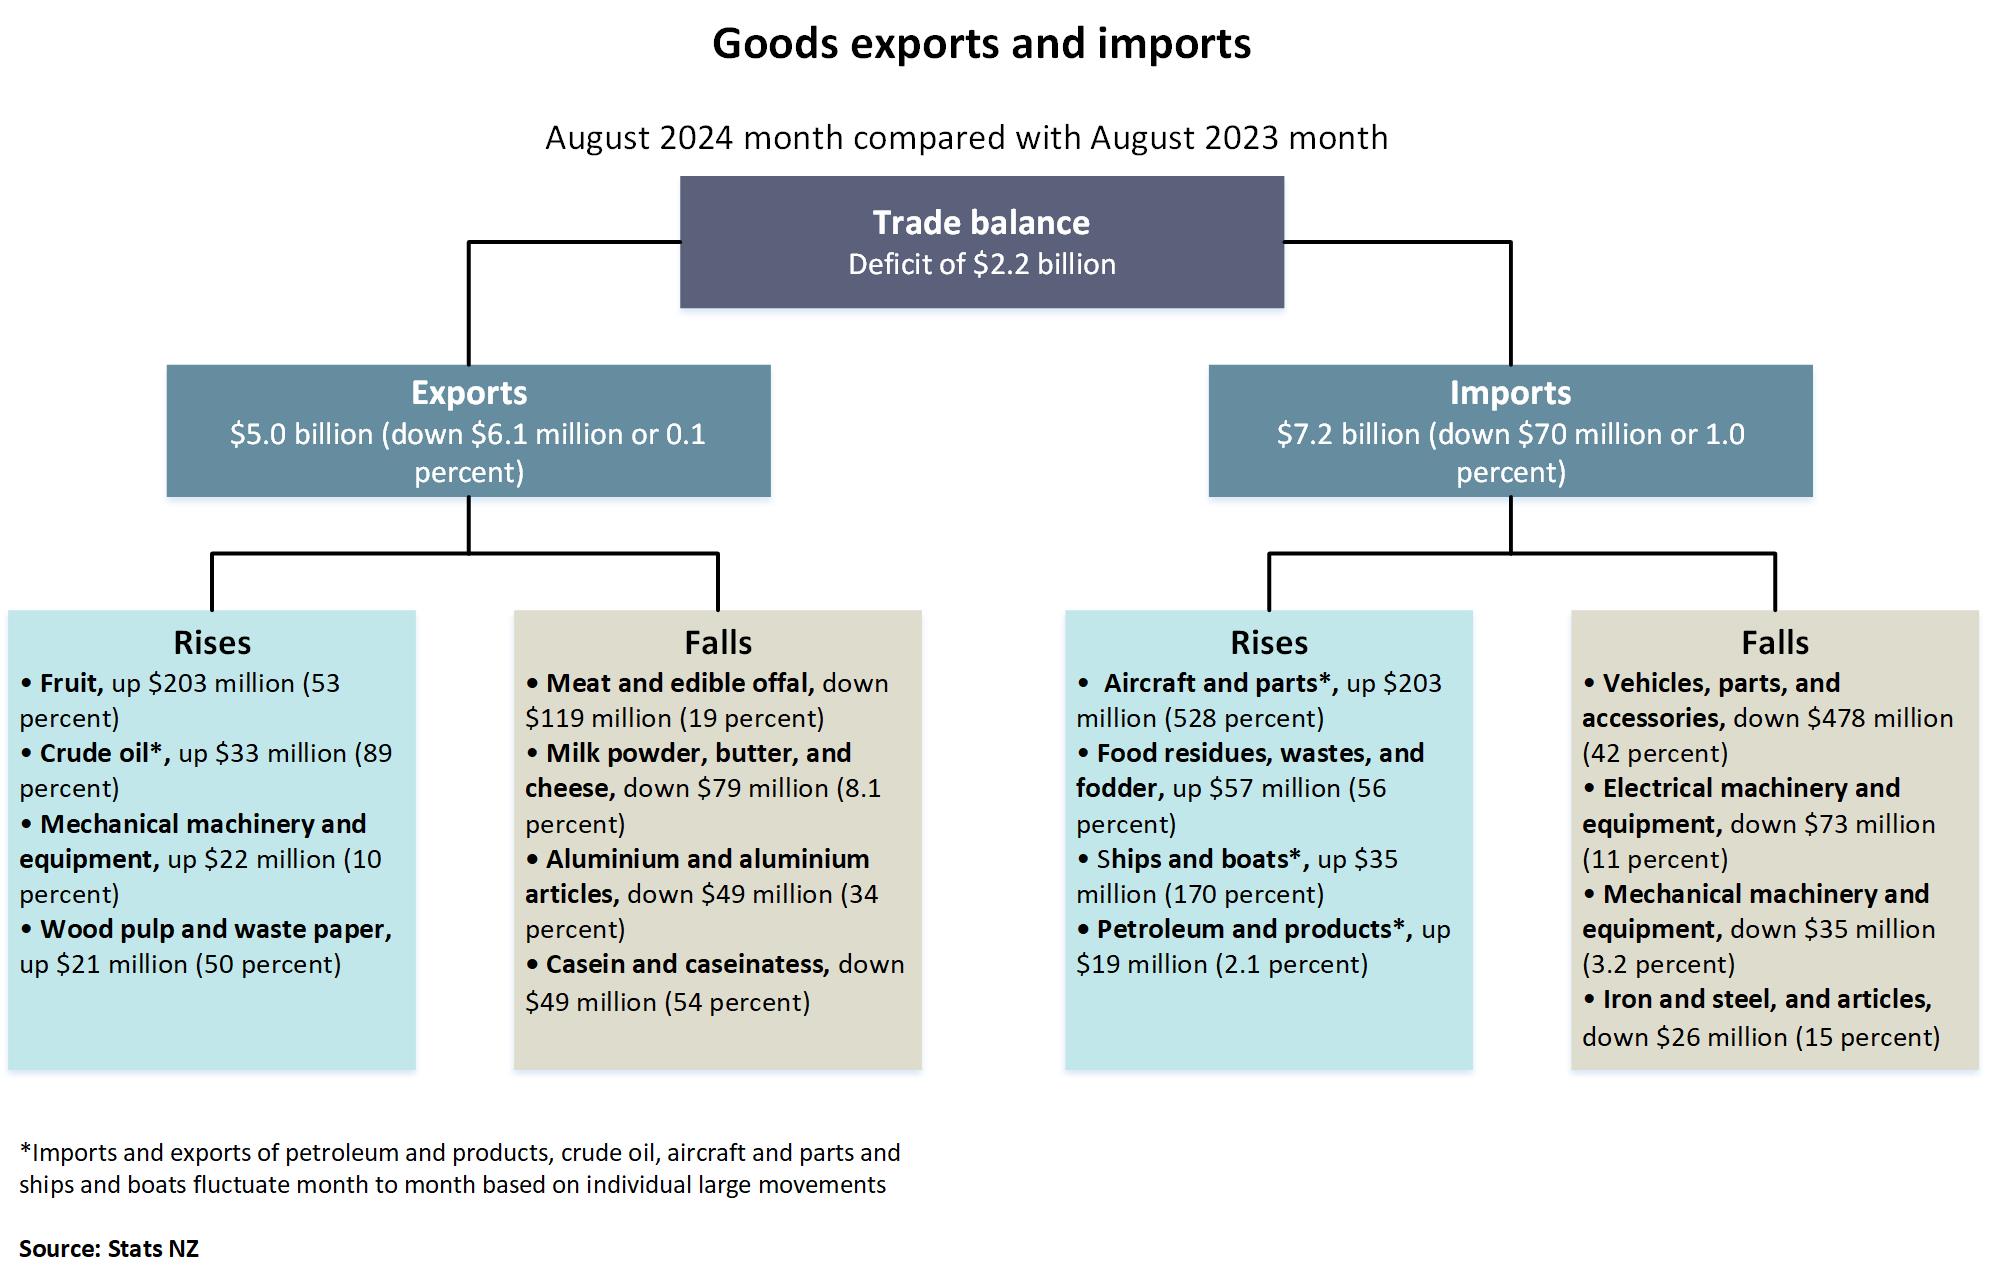
Text alternative for Goods exports and imports, August 2024 month compared with August 2023 month
The diagram shows goods exports and imports for the August 2024 month compared with the August 2023 month.
The trade balance is a deficit of $2.2 billion. This is the difference between exports valued at $5.0 billion (down $6.1 million or 0.1 percent) and imports valued at $7.2 billion (down $70 million or 1.0 percent).
Export commodities that rose included: fruit, up $203 million (53 percent); crude oil*, up $33 million (89 percent); mechanical machinery and equipment, up $22 million (10 percent); and wood pulp and waste paper, up $21 million (50 percent).
Export commodities that fell included: meat and edible offal, down $119 million (19 percent); milk powder, butter, and cheese, down $79 million (8.1 percent); aluminium and aluminium articles, down $49 million (34 percent); and casein and caseinates, down $49 million (54 percent).
Import commodities that rose included: aircraft and parts*, up $203 million (528 percent); food residues, wastes, and fodder, up $57 million (56 percent); ships and boats*, up $35 million (170 percent); and petrol and products*, up $19 million (2.1 percent).
Import commodities that fell included: vehicles, parts, and accessories, down $478 million (42 percent); electrical machinery and equipment, down $73 million (11 percent); mechanical machinery and equipment, down $35 million (3.2 percent); and iron and steel, and articles, down $26 million (15 percent).
*Imports and exports of petroleum and products, crude oil, aircraft and parts, and ships and boats fluctuate month to month based on individual large movements.
Source: Stats NZ
More data
Use Infoshare to access time-series data for imports and exports.
Subject category: Imports and exports
Overseas merchandise trade datasets has CSV data for goods imports and exports.
International trade: June 2024 quarter has information on trade in goods and services.
Definitions and metadata
Overseas merchandise trade - DataInfo+ provides the definitions of terms used in this release and general methodology used to produce overseas merchandise trade statistics.
Technical enquiries
Samisoni Makaafi
04 931 4600
[email protected]
ISSN 1178-0320
Next release
Overseas merchandise trade: September 2024 will be released on 22 October 2024.


