Overseas merchandise trade statistics provide information on imports and exports of merchandise goods between New Zealand and other countries.
Key facts
This release refers to trade in goods only.
In May 2024, compared with May 2023:
- goods exports rose by $202 million (2.9 percent), to $7.2 billion
- goods imports rose by $39 million (0.6 percent), to $7.0 billion
- the monthly trade balance was a surplus of $204 million.
| Year | Exports | Imports |
| 2004 | 3378483813 | 2701429236 |
| 2005 | 2943696620 | 3018190787 |
| 2006 | 3639320779 | 3754835795 |
| 2007 | 3349990699 | 3342019037 |
| 2008 | 3741267598 | 3910745226 |
| 2009 | 3962478702 | 3056406500 |
| 2010 | 4197023482 | 3427496613 |
| 2011 | 4618174010 | 4067974526 |
| 2012 | 4430536141 | 4175842951 |
| 2013 | 4075287230 | 4035459225 |
| 2014 | 4573821833 | 4309478840 |
| 2015 | 4354146229 | 3986975707 |
| 2016 | 4557765492 | 4214686649 |
| 2017 | 4906088963 | 4844068801 |
| 2018 | 5349960245 | 5150672241 |
| 2019 | 5742633106 | 5567705408 |
| 2020 | 5334781883 | 4112079196 |
| 2021 | 5794562593 | 5389626468 |
| 2022 | 6805654331 | 6657391295 |
| 2023 | 6953729010 | 6912113020 |
| 2024 | 7155608679 | 6951395346 |
Text alternative for Goods exports and imports, May 2024 month compared with May 2023 month
Exports
Goods exports rose by $202 million (2.9 percent) in May 2024 (to $7.2 billion), compared with May 2023.
Wine leads exports rise
Wine rose $47 million (38 percent) to $173 million.
| Year | Value |
| 2014 | 97039158 |
| 2015 | 121006973 |
| 2016 | 119669785 |
| 2017 | 120567603 |
| 2018 | 121826153 |
| 2019 | 151751876 |
| 2020 | 137802896 |
| 2021 | 130131057 |
| 2022 | 123051013 |
| 2023 | 125516776 |
| 2024 | 172952687 |
Milk powder, butter, and cheese rose $7.0 million (0.4 percent), to $1.95 billion.
May 2024 |
Change in |
Change in |
Change in |
Change in |
|
Milk powder, butter, |
1,950 |
7.0 |
0.4% |
* |
* |
Milk powder |
949 |
-53 |
-5.2% |
-7.9% |
2.9% |
Milk fats (including butter) |
420 |
17 |
4.1% |
-15% |
23% |
Cheese |
276 |
-15 |
-5.0% |
3.3% |
-8.1% |
Fresh milk and cream |
142 |
3.9 |
2.8% |
* |
* |
* Changes in total quantity are omitted due to differences in units of measure. |
|||||
Other dairy-based products, including infant formula and casein, rose in this period.
May 2024 |
Change in |
Change in |
Change in |
Change in |
|
Infant formula |
202 |
48 |
31% |
49% |
-12% |
Casein |
162 |
0.6 |
0.4% |
38% |
-27% |
Infant formula is included in preparations of milk, cereals, flour, and starch, which rose $37 million (16 percent) to $263 million.
Top monthly export movements by country
The monthly movements in May 2024, compared with May 2023, for our top export partners (in order of total annual goods exports) were:
- China: total exports were down $231 million (12 percent).
- The largest rise was preparations of milk, cereals, flour, and starch, up $31 million.
- The largest falls were meat and edible offal, down $166 million; fruit, down $34 million; and logs, wood, and wood articles, down $33 million.
- Australia: total exports were down $28 million (3.8 percent).
- The largest rises were precious metals, jewellery, and coins, up $21 million, and wine, up $11 million.
- The largest falls were mechanical machinery and equipment, down $14 million, and milk powder, butter, and cheese, down $13 million.
- USA: total exports were up $255 million (33 percent).
- The largest rises were meat and edible offal, up $81 million; milk powder, butter, and cheese, up $38 million; and wine, up $24 million.
- There were no significant falls over $10 million.
- EU: total exports were up $14 million (2.8 percent).
- The largest rises were fruit, up $22 million, and meat and edible offal, up $14 million.
- There were no significant falls over $10 million.
- Japan: total exports were up $55 million (12 percent).
- The largest rises were meat and edible offal, up $35 million, and aluminium and aluminium articles, up $14 million.
- The largest fall was fruit, down $17 million.
Imports
Goods imports rose by $39 million (0.6 percent) in May 2024 (to $7.0 billion), compared with May 2023.
Petroleum and products leads the rise in imports
Petroleum and products rose $223 million (28 percent) to $1.0 billion.
May 2024 |
Change in |
Change in |
Change in |
Change in |
|
Petroleum |
1,012 |
223 |
28% |
* |
* |
Diesel |
382 |
6.9 |
1.9% |
1.1% |
0.7% |
Petrol |
272 |
11 |
4.3% |
* |
* |
Jet fuel |
258 |
145 |
129% |
117% |
5.4% |
* Changes in total quantity are omitted due to differences in units of measure. |
|||||
Vehicles, parts, and accessories fell $154 million (16 percent) to $824 million. This was led by passenger cars that fell $115 million (19 percent) to $474 million, which was in turn led by electric passenger cars that fell $102 million (72 percent) to $39 million.
| Month | Value |
| Jan-19 | 3887929 |
| Feb-19 | 12683235 |
| Mar-19 | 2301114 |
| Apr-19 | 4059726 |
| May-19 | 13800264 |
| Jun-19 | 8152129 |
| Jul-19 | 7812598 |
| Aug-19 | 28427348 |
| Sep-19 | 32818144 |
| Oct-19 | 10004120 |
| Nov-19 | 22738472 |
| Dec-19 | 11132092 |
| Jan-20 | 4659656 |
| Feb-20 | 7013269 |
| Mar-20 | 7720225 |
| Apr-20 | 1667824 |
| May-20 | 1747259 |
| Jun-20 | 5053372 |
| Jul-20 | 2411360 |
| Aug-20 | 12845906 |
| Sep-20 | 10141752 |
| Oct-20 | 6798508 |
| Nov-20 | 5244741 |
| Dec-20 | 7165682 |
| Jan-21 | 6734577 |
| Feb-21 | 12414874 |
| Mar-21 | 22796655 |
| Apr-21 | 11926582 |
| May-21 | 45102646 |
| Jun-21 | 24568944 |
| Jul-21 | 34183679 |
| Aug-21 | 42533316 |
| Sep-21 | 47612763 |
| Oct-21 | 23429238 |
| Nov-21 | 64422275 |
| Dec-21 | 33166767 |
| Jan-22 | 42276424 |
| Feb-22 | 63152018 |
| Mar-22 | 33849932 |
| Apr-22 | 22971855 |
| May-22 | 33275686 |
| Jun-22 | 31565574 |
| Jul-22 | 141351036 |
| Aug-22 | 52822239 |
| Sep-22 | 130387233 |
| Oct-22 | 126835869 |
| Nov-22 | 212642648 |
| Dec-22 | 47096047 |
| Jan-23 | 65701798 |
| Feb-23 | 133340538 |
| Mar-23 | 98608148 |
| Apr-23 | 66307400 |
| May-23 | 141208037 |
| Jun-23 | 48511994 |
| Jul-23 | 131694597 |
| Aug-23 | 96106685 |
| Sep-23 | 128992055 |
| Oct-23 | 89918558 |
| Nov-23 | 83679246 |
| Dec-23 | 53200280 |
| Jan-24 | 48741830 |
| Feb-24 | 30072351 |
| Mar-24 | 27341065 |
| Apr-24 | 19145535 |
| May-24 | 39225315 |
Top monthly import movements by country
The monthly movements in May 2024, compared with May 2023, for our top import partners (in order of total annual goods imports) were:
- China: total imports were up $36 million (2.6 percent).
- The largest rises were petroleum and products, up $58 million; mechanical machinery and equipment, up $14 million; and plastic and plastic articles, up $14 million.
- The largest falls were vehicles, parts, and accessories, down $70 million; electrical machinery and equipment, down $28 million; and iron and steel, and articles, down $11 million.
- EU: total imports were down $18 million (1.8 percent).
- The largest rise was vehicles, parts, and accessories, up $33 million.
- The largest falls were pharmaceutical products, down $20 million, and mechanical machinery and equipment, down $16 million.
- Australia: total imports were down $38 million (4.7 percent).
- The largest rises were inorganic chemicals, up $22 million, and cereals, up $21 million.
- The largest falls were vehicles, parts, and accessories, down $30 million, and ships, boats, and floating structures, down $13 million.
- USA: total imports were up $14 million (1.6 percent).
- The largest rises were food residues, wastes, and fodder, up $41 million; vehicles, parts, and accessories, up $16 million; and mechanical machinery and equipment, up $13 million.
- The largest falls were aircraft and parts, down $28 million, and electrical machinery and equipment, down $15 million.
- South Korea: total imports were up $31 million (5.8 percent).
- The largest rise was petroleum and products, up $65 million.
- The largest fall was vehicles, parts, and accessories, down $22 million.
Trade surplus in May 2024
The monthly trade balance was a surplus of $204 million.
| Month | Trade balance |
| May-15 | 367170522 |
| Jun-15 | -181952163 |
| Jul-15 | -730443957 |
| Aug-15 | -1090170040 |
| Sep-15 | -1140014218 |
| Oct-15 | -904822585 |
| Nov-15 | -795426228 |
| Dec-15 | -41905853 |
| Jan-16 | 12320231 |
| Feb-16 | 366925311 |
| Mar-16 | 188849850 |
| Apr-16 | 349530073 |
| May-16 | 343078843 |
| Jun-16 | 106790388 |
| Jul-16 | -351427805 |
| Aug-16 | -1239891851 |
| Sep-16 | -1387987389 |
| Oct-16 | -797651150 |
| Nov-16 | -723201112 |
| Dec-16 | -1435171 |
| Jan-17 | -226543047 |
| Feb-17 | -42276469 |
| Mar-17 | 261589138 |
| Apr-17 | 546879922 |
| May-17 | 62020162 |
| Jun-17 | 243117487 |
| Jul-17 | 92027349 |
| Aug-17 | -1174342582 |
| Sep-17 | -1165209854 |
| Oct-17 | -839633458 |
| Nov-17 | -1222417301 |
| Dec-17 | 614310559 |
| Jan-18 | -662421494 |
| Feb-18 | 188256546 |
| Mar-18 | -150609406 |
| Apr-18 | 199745211 |
| May-18 | 199288004 |
| Jun-18 | -285260079 |
| Jul-18 | -203110333 |
| Aug-18 | -1566757996 |
| Sep-18 | -1579921712 |
| Oct-18 | -1305105133 |
| Nov-18 | -1003973060 |
| Dec-18 | 9286883 |
| Jan-19 | -934926531 |
| Feb-19 | -93584137 |
| Mar-19 | 825181314 |
| Apr-19 | 360963002 |
| May-19 | 174927698 |
| Jun-19 | 329812747 |
| Jul-19 | -732335397 |
| Aug-19 | -1641634097 |
| Sep-19 | -1309937148 |
| Oct-19 | -1038380593 |
| Nov-19 | -786493088 |
| Dec-19 | 379772255 |
| Jan-20 | -395635011 |
| Feb-20 | 550639307 |
| Mar-20 | 522807892 |
| Apr-20 | 1374019783 |
| May-20 | 1222702687 |
| Jun-20 | 416538602 |
| Jul-20 | 387761796 |
| Aug-20 | -320606284 |
| Sep-20 | -1132334429 |
| Oct-20 | -465913506 |
| Nov-20 | 679104 |
| Dec-20 | 230069561 |
| Jan-21 | -729765438 |
| Feb-21 | 449847010 |
| Mar-21 | -182555509 |
| Apr-21 | 557914991 |
| May-21 | 404936125 |
| Jun-21 | 442108253 |
| Jul-21 | -387158502 |
| Aug-21 | -2132508281 |
| Sep-21 | -2166033786 |
| Oct-21 | -1282573004 |
| Nov-21 | -1085761728 |
| Dec-21 | -990246456 |
| Jan-22 | -1106744295 |
| Feb-22 | -714801157 |
| Mar-22 | -593488596 |
| Apr-22 | 469495559.5 |
| May-22 | 148263036 |
| Jun-22 | -1132868318 |
| Jul-22 | -1415192071 |
| Aug-22 | -2634137110 |
| Sep-22 | -2519671472 |
| Oct-22 | -2315527621 |
| Nov-22 | -2183787239 |
| Dec-22 | -650530508 |
| Jan-23 | -2095237898 |
| Feb-23 | -846757630 |
| Mar-23 | -1602490156 |
| Apr-23 | 220854073 |
| May-23 | 41615990.2 |
| Jun-23 | -114738381 |
| Jul-23 | -1174149043 |
| Aug-23 | -2266681329 |
| Sep-23 | -2420838856 |
| Oct-23 | -1732504563 |
| Nov-23 | -1258971689 |
| Dec-23 | -372771305 |
| Jan-24 | -1064170538 |
| Feb-24 | -319013198.7 |
| Mar-24 | 468222533.5 |
| Apr-24 | -3047463.78 |
| May-24 | 204213333.2 |
May 2024 year
Annual values are actual and compared with the year ended May 2023.
- Annual goods exports were valued at $68.9 billion, down $3.8 billion from the previous year.
- Annual goods imports were valued at $78.9 billion, down $10.9 billion from the previous year.
- The annual trade deficit was $10.1 billion. In the year ended May 2023 the trade deficit was $17.1 billion.
| Year | Trade balance |
| May-14 | 1319568933 |
| Jun-14 | 1188788452 |
| Jul-14 | 1034361247 |
| Aug-14 | 1805429958 |
| Sep-14 | 667403260.8 |
| Oct-14 | -55529708.2 |
| Nov-14 | -491585024.2 |
| Dec-14 | -1183419240 |
| Jan-15 | -1416085181 |
| Feb-15 | -2129195222 |
| Mar-15 | -2372062053 |
| Apr-15 | -2655363178 |
| May-15 | -2552535649 |
| Jun-15 | -2974536000 |
| Jul-15 | -2762446249 |
| Aug-15 | -3388079713 |
| Sep-15 | -3169130897 |
| Oct-15 | -3182409618 |
| Nov-15 | -3694857477 |
| Dec-15 | -3536562994 |
| Jan-16 | -3576399416 |
| Feb-16 | -3293445747 |
| Mar-16 | -3765397257 |
| Apr-16 | -3599939057 |
| May-16 | -3624030736 |
| Jun-16 | -3335288185 |
| Jul-16 | -2956272033 |
| Aug-16 | -3105993844 |
| Sep-16 | -3353967015 |
| Oct-16 | -3246795580 |
| Nov-16 | -3174570464 |
| Dec-16 | -3134099782 |
| Jan-17 | -3372963060 |
| Feb-17 | -3782164840 |
| Mar-17 | -3709425552 |
| Apr-17 | -3512075703 |
| May-17 | -3793134384 |
| Jun-17 | -3656807285 |
| Jul-17 | -3213352131 |
| Aug-17 | -3147802862 |
| Sep-17 | -2925025327 |
| Oct-17 | -2967007635 |
| Nov-17 | -3466223824 |
| Dec-17 | -2850478094 |
| Jan-18 | -3286356541 |
| Feb-18 | -3055823526 |
| Mar-18 | -3468022070 |
| Apr-18 | -3815156781 |
| May-18 | -3677888939 |
| Jun-18 | -4206266505 |
| Jul-18 | -4501404187 |
| Aug-18 | -4893819601 |
| Sep-18 | -5308531459 |
| Oct-18 | -5774003134 |
| Nov-18 | -5555558893 |
| Dec-18 | -6160582569 |
| Jan-19 | -6433087606 |
| Feb-19 | -6714928289 |
| Mar-19 | -5739137569 |
| Apr-19 | -5577919778 |
| May-19 | -5602280084 |
| Jun-19 | -4987207258 |
| Jul-19 | -5516432322 |
| Aug-19 | -5591308423 |
| Sep-19 | -5321323859 |
| Oct-19 | -5054599319 |
| Nov-19 | -4837119347 |
| Dec-19 | -4466633975 |
| Jan-20 | -3927342455 |
| Feb-20 | -3283119011 |
| Mar-20 | -3585492433 |
| Apr-20 | -2572435652 |
| May-20 | -1524660663 |
| Jun-20 | -1437934808 |
| Jul-20 | -317837615 |
| Aug-20 | 1003190198 |
| Sep-20 | 1180792917 |
| Oct-20 | 1753260004 |
| Nov-20 | 2540432196 |
| Dec-20 | 2390729502 |
| Jan-21 | 2056599075 |
| Feb-21 | 1955806778 |
| Mar-21 | 1250443377 |
| Apr-21 | 434338585 |
| May-21 | -383427977 |
| Jun-21 | -357858326 |
| Jul-21 | -1132778624 |
| Aug-21 | -2944680621 |
| Sep-21 | -3978379978 |
| Oct-21 | -4795039476 |
| Nov-21 | -5881480308 |
| Dec-21 | -7101796325 |
| Jan-22 | -7478775182 |
| Feb-22 | -8643423349 |
| Mar-22 | -9054356436 |
| Apr-22 | -9142775867 |
| May-22 | -9399448956 |
| Jun-22 | -10974425528 |
| Jul-22 | -12002459097 |
| Aug-22 | -12504087926 |
| Sep-22 | -12857725612 |
| Oct-22 | -13890680229 |
| Nov-22 | -14988705740 |
| Dec-22 | -14648989792 |
| Jan-23 | -15637483395 |
| Feb-23 | -15769439868 |
| Mar-23 | -16778441428 |
| Apr-23 | -17027082914 |
| May-23 | -17133729960 |
| Jun-23 | -16115600023 |
| Jul-23 | -15874556995 |
| Aug-23 | -15507101214 |
| Sep-23 | -15408268598 |
| Oct-23 | -14825245540 |
| Nov-23 | -13900429990 |
| Dec-23 | -13622670787 |
| Jan-24 | -12591603427 |
| Feb-24 | -12063858996 |
| Mar-24 | -9993146306 |
| Apr-24 | -10217047843 |
| May-24 | -10054450500 |
| Year | Exports | Imports |
| May-14 | 50989992815 | 49670423882 |
| Jun-14 | 51161136425 | 49972347973 |
| Jul-14 | 51017556730 | 49983195483 |
| Aug-14 | 51254401927 | 49448971969 |
| Sep-14 | 51053416397 | 50386013136 |
| Oct-14 | 50823329360 | 50878859068 |
| Nov-14 | 50421695797 | 50913280821 |
| Dec-14 | 50074641250 | 51258060490 |
| Jan-15 | 49687287730 | 51103372911 |
| Feb-15 | 49042886225 | 51172081447 |
| Mar-15 | 48915143951 | 51287206004 |
| Apr-15 | 48642733035 | 51298096213 |
| May-15 | 48423057431 | 50975593080 |
| Jun-15 | 48396163181 | 51370699181 |
| Jul-15 | 48880453005 | 51642899254 |
| Aug-15 | 49057455495 | 52445535208 |
| Sep-15 | 49117987199 | 52287118096 |
| Oct-15 | 48918947187 | 52101356805 |
| Nov-15 | 48952719875 | 52647577352 |
| Dec-15 | 48973550776 | 52510113770 |
| Jan-16 | 49187466085 | 52763865501 |
| Feb-16 | 49537612567 | 52831058314 |
| Mar-16 | 48833243763 | 52598641020 |
| Apr-16 | 49026536183 | 52626475240 |
| May-16 | 49230155446 | 52854186182 |
| Jun-16 | 49324864243 | 52660152428 |
| Jul-16 | 49121608220 | 52077880253 |
| Aug-16 | 48793893786 | 51899887630 |
| Sep-16 | 48583604241 | 51937571256 |
| Oct-16 | 48696300602 | 51943096182 |
| Nov-16 | 48493856234 | 51668426698 |
| Dec-16 | 48486904078 | 51621003860 |
| Jan-17 | 48527688853 | 51900651913 |
| Feb-17 | 48305011954 | 52087176794 |
| Mar-17 | 48694076739 | 52403502291 |
| Apr-17 | 49076148830 | 52588224533 |
| May-17 | 49424472301 | 53217606685 |
| Jun-17 | 49873491508 | 53530298793 |
| Jul-17 | 50528773127 | 53742125258 |
| Aug-17 | 50834401328 | 53982204190 |
| Sep-17 | 51160043929 | 54085069256 |
| Oct-17 | 51791672041 | 54758679676 |
| Nov-17 | 52532859588 | 55999083412 |
| Dec-17 | 53625488161 | 56475966255 |
| Jan-18 | 53965184420 | 57251540961 |
| Feb-18 | 54395355682 | 57451179208 |
| Mar-18 | 54602966051 | 58070988121 |
| Apr-18 | 54860205151 | 58675361932 |
| May-18 | 55304076433 | 58981965372 |
| Jun-18 | 55490192916 | 59696459421 |
| Jul-18 | 56206201587 | 60707605774 |
| Aug-18 | 56493336022 | 61387155623 |
| Sep-18 | 56954044261 | 62262575720 |
| Oct-18 | 57226558637 | 63000561771 |
| Nov-18 | 57470599037 | 63026157930 |
| Dec-18 | 57251104265 | 63411686834 |
| Jan-19 | 57320341207 | 63753428813 |
| Feb-19 | 57583937302 | 64298865591 |
| Mar-19 | 58386241764 | 64125379333 |
| Apr-19 | 58900924296 | 64478844074 |
| May-19 | 59293597157 | 64895877241 |
| Jun-19 | 59378412551 | 64365619809 |
| Jul-19 | 58963308257 | 64479740579 |
| Aug-19 | 59050318141 | 64641626564 |
| Sep-19 | 59153331446 | 64474655305 |
| Oct-19 | 59330562863 | 64385162182 |
| Nov-19 | 59689705163 | 64526824510 |
| Dec-19 | 59899236281 | 64365870256 |
| Jan-20 | 60232430772 | 64159773227 |
| Feb-20 | 60412604751 | 63695723762 |
| Mar-20 | 60424643728 | 64010136161 |
| Apr-20 | 60267881085 | 62840316737 |
| May-20 | 59860029862 | 61384690525 |
| Jun-20 | 59923371349 | 61361306157 |
| Jul-20 | 59958852127 | 60276689742 |
| Aug-20 | 60267415950 | 59264225752 |
| Sep-20 | 59811824505 | 58631031588 |
| Oct-20 | 59608519266 | 57855259262 |
| Nov-20 | 59310670094 | 56770237898 |
| Dec-20 | 59352090268 | 56961360766 |
| Jan-21 | 58791158732 | 56734559657 |
| Feb-21 | 58648923039 | 56693116261 |
| Mar-21 | 58509007529 | 57258564152 |
| Apr-21 | 58727983912 | 58293645327 |
| May-21 | 59187764622 | 59571192599 |
| Jun-21 | 60317064345 | 60674922671 |
| Jul-21 | 61137731227 | 62270509851 |
| Aug-21 | 61130377632 | 64075058253 |
| Sep-21 | 61626437404 | 65604817382 |
| Oct-21 | 62203301840 | 66998341316 |
| Nov-21 | 62957144846 | 68838625154 |
| Dec-21 | 63494172023 | 70595968348 |
| Jan-22 | 64179336420 | 71658111602 |
| Feb-22 | 64623309414 | 73266732763 |
| Mar-22 | 65620086364 | 74674442800 |
| Apr-22 | 66238532811 | 75381308679 |
| May-22 | 67249624549 | 76649073506 |
| Jun-22 | 67320451696 | 78294877224 |
| Jul-22 | 67880911372 | 79883370469 |
| Aug-22 | 68799762323 | 81303850249 |
| Sep-22 | 70313919973 | 83171645585 |
| Oct-22 | 70886872314 | 84777552543 |
| Nov-22 | 71544229919 | 86532935659 |
| Dec-22 | 71970611821 | 86619601613 |
| Jan-23 | 72476808672 | 88114292067 |
| Feb-23 | 72353029898 | 88122469766 |
| Mar-23 | 72141630258 | 88920071686 |
| Apr-23 | 72569483052 | 89596565966 |
| May-23 | 72717557731 | 89851287691 |
| Jun-23 | 72672011431 | 88787611454 |
| Jul-23 | 71711512987 | 87586069982 |
| Aug-23 | 71402878992 | 86909980206 |
| Sep-23 | 70258409955 | 85666678553 |
| Oct-23 | 69672337565 | 84497583105 |
| Nov-23 | 69280620301 | 83181050291 |
| Dec-23 | 68620962133 | 82243632920 |
| Jan-24 | 68136465013 | 80728068440 |
| Feb-24 | 68854669181 | 80918528177 |
| Mar-24 | 68967646880 | 78960793186 |
| Apr-24 | 68690071924 | 78907119767 |
| May-24 | 68891951593 | 78946402093 |
Text alternative for Goods exports and imports, May 2024 month compared with May 2023 month
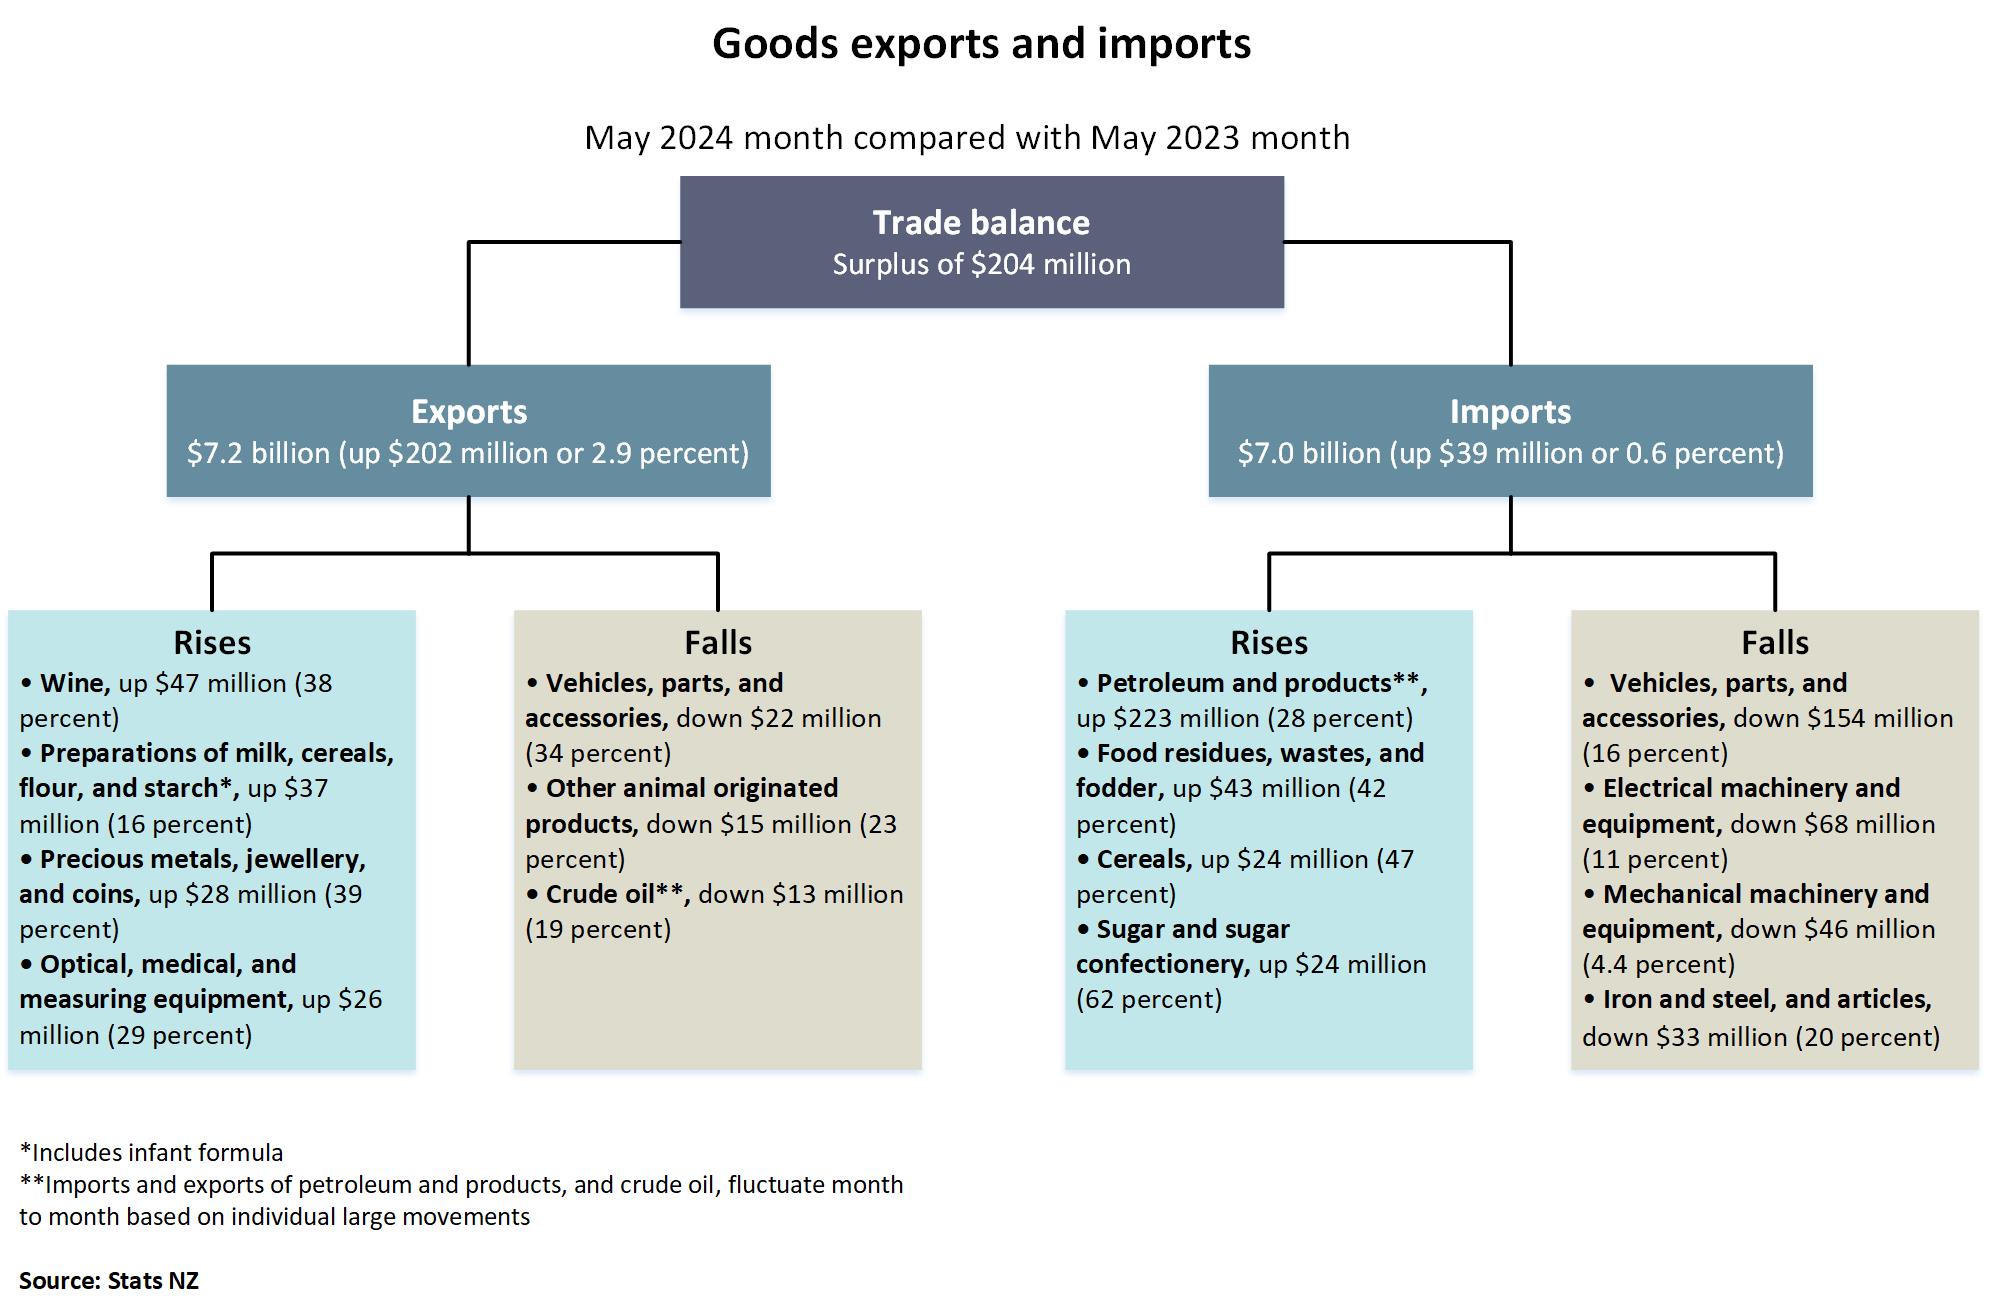
The diagram shows goods exports and imports for the May 2024 month compared with the May 2023 month.
The trade balance is a surplus of $204 million. This is the difference between exports valued at $7.2 billion (up $202 million or 2.9 percent) and imports valued at $7.0 billion (up $39 million or 0.6 percent).
Export commodities that rose included: wine, up $47 million (38 percent); preparations of milk, cereals, flour, and starch*, up $37 million (16 percent); precious metals, jewellery, and coins, up $28 million (39 percent); and optical, medical, and measuring equipment, up $26 million (29 percent).
Export commodities that fell included: vehicles, parts, and accessories, down $22 million (34 percent); other animal originated products, down $15 million (23 percent); and crude oil**, down $13 million (19 percent).
Import commodities that rose included: petroleum and products**, up $223 million (28 percent); food residues, wastes, and fodder, up $43 million (42 percent); cereals, up $24 million (47 percent); and sugars and sugar confectionery, up $24 million (62 percent).
Import commodities that fell included: vehicles, parts, and accessories, down $154 million (16 percent); electrical machinery and equipment, down $68 million (11 percent); mechanical machinery and equipment, down $46 million (4.4 percent); and iron and steel, and articles, down $33 million (20 percent).
*Includes infant formula.
**Imports of petroleum and products fluctuate month to month based on individual large movements.
Source: Stats NZ
More data
Use Infoshare to access time-series data for imports and exports.
Subject category: Imports and exports
Overseas merchandise trade datasets has CSV data for goods imports and exports.
International trade: March 2024 quarter has information on trade in goods and services.
Definitions and metadata
Overseas merchandise trade - DataInfo+ provides the definitions of terms used in this release and general methodology used to produce overseas merchandise trade statistics.
Technical enquiries
Samisoni Makaafi
04 931 4600
[email protected]
ISSN 1178-0320
Next release
Overseas merchandise trade: June 2024 will be released on 22 July 2024.


