New Zealand's resident population provisionally grew by 12,700 or 0.2 percent over the year, to reach 5.12 million at 30 June 2022, Stats NZ said today.
This is the lowest annual growth rate since June 1986 when the population barely changed (0.0 percent).
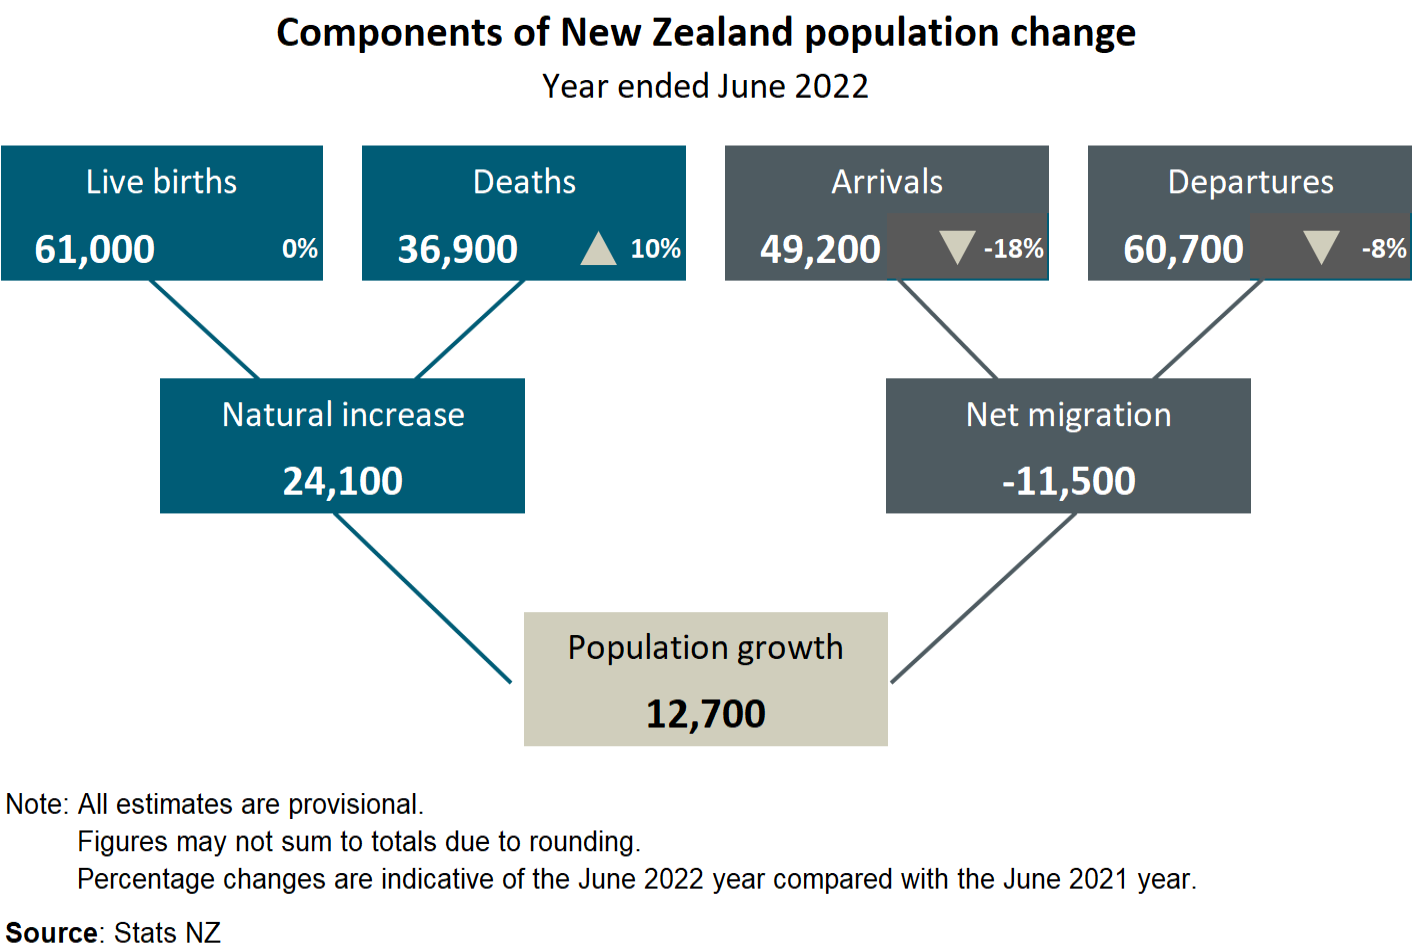
New Zealand's population change is a combination of natural increase (births minus deaths) and net migration (migrant arrivals minus migrant departures).
"The net migration loss combined with a lower natural increase has resulted in this low level of population growth," population estimates and projections acting manager Rebekah Hennessey said.
Text alternative for Components of New Zealand population change, year ended June 2021
An ageing population
In the year ended June 2022, the number of births remained around 61,000 while the number of deaths grew by 10.1 percent to 36,900 from 33,500 in the year ended June 2021, due partly to population ageing. This led to natural increase reducing to 24,100 in the year ended June 2022 from 27,700 in the year ended June 2021. Deaths increase as population ages has more information on the impact of an ageing population on the number of deaths.
The narrowing gap between births and deaths is projected to continue, according to the recently published National population projections: 2022(base)-2073.
| At 30 June | Population change | Natural increase | Net migration |
| 1992 | 36600 | 33000 | 3600 |
| 1993 | 40500 | 31800 | 8700 |
| 1994 | 47800 | 31000 | 16800 |
| 1995 | 53400 | 30700 | 22700 |
| 1996 | 58600 | 29100 | 29500 |
| 1997 | 49300 | 29800 | 16800 |
| 1998 | 33700 | 30500 | 500 |
| 1999 | 20100 | 28700 | -11400 |
| 2000 | 22600 | 29600 | -9800 |
| 2001 | 22700 | 29200 | -9300 |
| 2002 | 68000 | 26500 | 32800 |
| 2003 | 78800 | 27500 | 42500 |
| 2004 | 60300 | 29600 | 22000 |
| 2005 | 46300 | 29100 | 8600 |
| 2006 | 50700 | 31300 | 10700 |
| 2007 | 39200 | 33800 | 10100 |
| 2008 | 36000 | 35900 | 4700 |
| 2009 | 42800 | 35000 | 12500 |
| 2010 | 48100 | 36200 | 16500 |
| 2011 | 33300 | 34100 | 3900 |
| 2012 | 24100 | 31900 | -3200 |
| 2013 | 34000 | 30800 | 7900 |
| 2014 | 74400 | 29300 | 33500 |
| 2015 | 92900 | 27700 | 53400 |
| 2016 | 104700 | 28400 | 64600 |
| 2017 | 99500 | 28300 | 59500 |
| 2018 | 87000 | 26700 | 49000 |
| 2019 | 78600 | 26500 | 52100 |
| 2020 | 111000 | 26200 | 84800 |
| 2021 | 21200 | 27700 | -6500 |
| 2022 | 12700 | 24100 | -11500 |
Among broad age groups, the population aged 65 years and over was the fastest growing, with an annual increase of 2.8 percent or 22,800 people, in the year ended June 2022. Most of this increase was a result of people born in the mid-1950s turning 65 and moving into this age group.
In contrast, the number of people aged 15-39 years shrank by 0.5 percent, or 8,700 people. This drop is mainly due to a population loss from migration, as well as more people moving out of this age group (to older ages) than moving into this age group (from younger ages).
| At 30 June | 0-14 | 15-39 | 40-64 | 65+ |
| 1991 | 807200 | 1399100 | 897500 | 391300 |
| 1992 | 814300 | 1402500 | 915300 | 399600 |
| 1993 | 824700 | 1405700 | 934100 | 407800 |
| 1994 | 835300 | 1412200 | 956600 | 415900 |
| 1995 | 847500 | 1421100 | 981400 | 423400 |
| 1996 | 859500 | 1433900 | 1008500 | 430100 |
| 1997 | 869500 | 1437200 | 1038300 | 436300 |
| 1998 | 876300 | 1429600 | 1067000 | 442200 |
| 1999 | 877300 | 1413600 | 1096200 | 447900 |
| 2000 | 878700 | 1400700 | 1124900 | 453500 |
| 2001 | 877200 | 1388800 | 1153900 | 460600 |
| 2002 | 883600 | 1405700 | 1191800 | 467500 |
| 2003 | 890000 | 1430700 | 1230900 | 475700 |
| 2004 | 893100 | 1443400 | 1266400 | 484600 |
| 2005 | 890200 | 1452100 | 1295200 | 496400 |
| 2006 | 888300 | 1463700 | 1321000 | 511600 |
| 2007 | 891300 | 1463700 | 1343500 | 525300 |
| 2008 | 895500 | 1460400 | 1368800 | 535000 |
| 2009 | 901100 | 1461000 | 1392100 | 548300 |
| 2010 | 908100 | 1464600 | 1414400 | 563500 |
| 2011 | 910700 | 1459100 | 1434100 | 580100 |
| 2012 | 909800 | 1450500 | 1444700 | 603000 |
| 2013 | 908800 | 1452300 | 1455000 | 626000 |
| 2014 | 911700 | 1484500 | 1471700 | 648500 |
| 2015 | 916200 | 1533800 | 1489200 | 670200 |
| 2016 | 924600 | 1590000 | 1507500 | 692000 |
| 2017 | 936800 | 1637100 | 1525800 | 713800 |
| 2018 | 946400 | 1676900 | 1542300 | 734900 |
| 2019 | 956000 | 1705600 | 1557700 | 759800 |
| 2020 | 966400 | 1750100 | 1581800 | 791900 |
| 2021 | 967900 | 1738800 | 1587200 | 817400 |
| 2022 | 964300 | 1730100 | 1589500 | 840200 |
Text alternative for Components of New Zealand population change, year ended June 2021
Diagram shows population change for the year ended June 2022. Overall, population growth is 12,700 made up of a net gain of 24,100 natural increase (based on 61,000 live births, and 36,900 deaths) and a net migration of -11,500 (based on 49,200 migrant arrivals and 60,700 migrant departures). All estimates are provisional.


