With the development of various types of fixed marine observation equipment, satellite remote sensing technology, and computer simulation technology, modern marine scientific research has entered the era of big data.
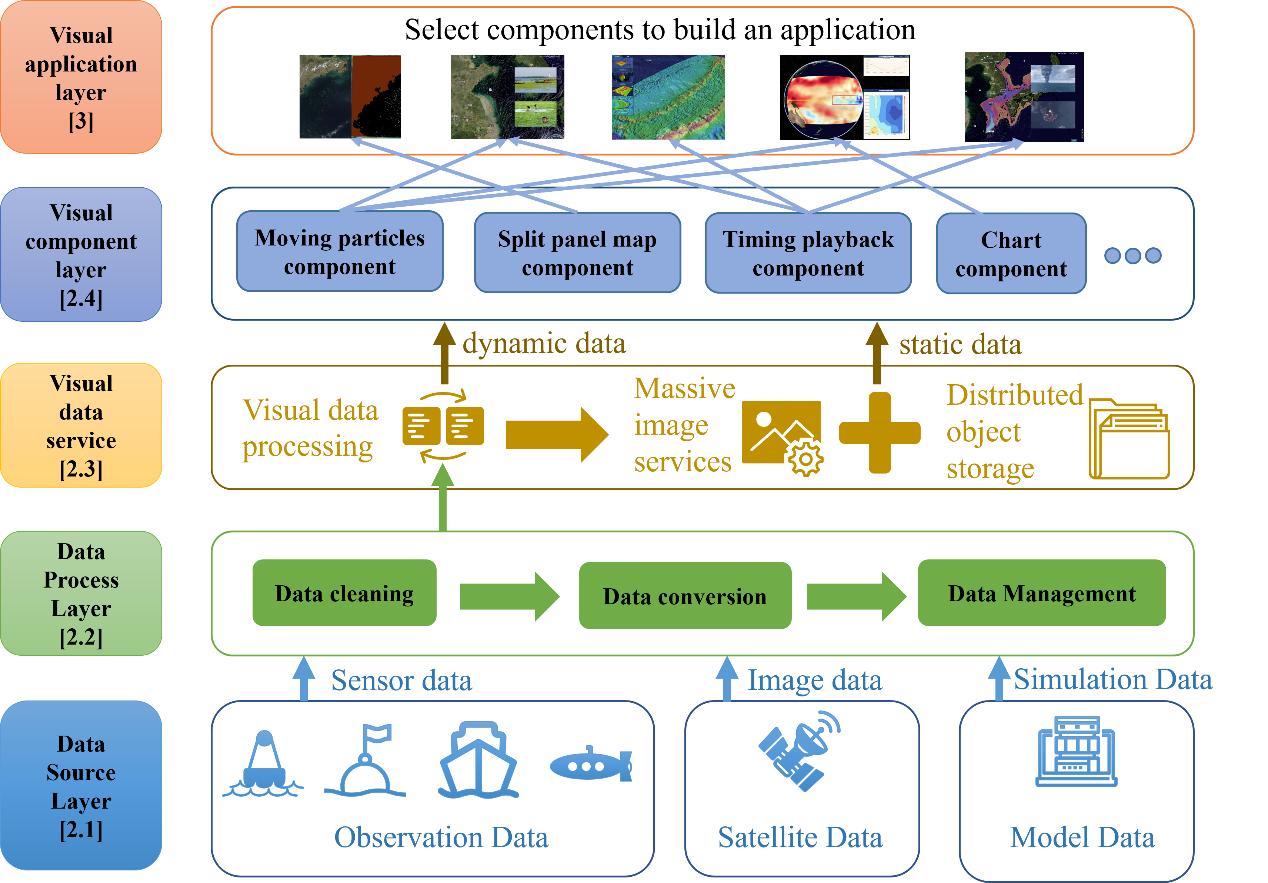
A research team led by Dr. LI Xiaofeng from the Institute of Oceanology of the Chinese Academy of Sciences (IOCAS) constructed a unified visual data service and a component-based interactive visualization structure to solve the problem of difficulty of data analyzing caused by data complexity.
The study was published in Big Earth Data.
Compared with traditional visualization frameworks, a visual data layer is added between the front and back ends, which provides unified data services for different visual components. In the visual data layer, the data are converted and encoded after cleaning, quality control, and standardization by the data service layer based on the data type.
The researchers constructed the service interface of the Restful API architecture, which provides user interface with the component library for the visual component layer, and allows rapid retrieval and application of data. Commonly used analysis methods were combined in an orderly manner in the visual component layer to form an independent visual ocean component.
Through the component-based visualization platform, they have built many visualization applications. For example, they used a coupled storm surge and wave model through the integration of multiple visualization components, and the temporal and spatial fields of the model data were interlinked and cooperated to visually display the path, size, and intensity of typhoon transport.
Moreover, water gain caused by the wave field around the typhoon, the distribution of the wind field and the storm surge were integrated to predict the development of the storm surge and the warning level of dikes.


