What is measured
This indicator measures the state and trends for the temperature of the uppermost layers of surface water in oceanic and coastal regions around Aotearoa New Zealand using two satellite datasets.
We report on annual and seasonal trends, as well as monthly and annual anomalies (deviations from a climate baseline) for ocean and coastal sea-surface temperature around New Zealand, using data from the Optimum Interpolation Sea Surface Temperature version 2.1 product (OISST) satellite between 1981 and 2023. We report the percentage of the 2022 year that ocean and coastal regions spent on average in marine heatwaves (prolonged events of abnormally warm water). We also provide monthly coastal sea-surface temperatures and anomalies from the MODIS-Aqua satellite between 2002 and 2022.
Why it is important
Measuring oceanic sea-surface temperature tells us how fast the surface layer of the ocean is warming. The surface mixed layer of the ocean typically varies between approximately 10 and 300 metres in depth and is where the majority of primary production (phytoplankton growth that forms the basis of food webs in the marine environment) usually occurs (Pinkerton et al., 2023). Increased temperatures in this layer can affect rates of marine primary production (which can have broad impacts on marine ecosystems) and carbon cycles.
In coastal areas, the surface mixed layer can extend to the seabed, and measuring changes in sea-surface temperature in this layer gives information on temperature changes throughout the water column, which can affect seabed primary producers (such as seaweeds) and seabed ecological communities.
Changes in sea-surface temperatures can impact marine processes, environments, species, and nature's contribution to people. In addition to changes in primary productivity, impacts include:
- some species, including taonga species such as some sharks, dolphins, and whales, changing location to maintain their temperature (Stephenson et al., 2020, 2023); if they are unable to move, they may not be able to survive (Law et al., 2017)
- changes to the reproduction and growth of fishes such as snapper and other commercially-important fished species (Pinkerton, 2017)
- an increase in the occurrence of invasive species and diseases due to warmer waters (Willis et al., 2007)
- ocean warming causing thermal expansion and contributing to sea-level rise (Pörtner et al., 2019; WCRP Global Sea Level Budget Group, 2018).
Marine heatwaves are prolonged events of abnormally warm water that can have significant impacts on marine ecosystems and their contribution to people (Hobday et al., 2016, 2018; Smale et al., 2019; Smith et al., 2021). Globally, marine heatwaves are increasing in duration, frequency, and intensity (Frölicher et al., 2018; Oliver et al., 2018, 2019; Smale et al., 2019) and several recent marine heatwave events have occurred in New Zealand. This global increase in marine heatwaves is expected to continue under future climate change, potentially pushing many marine organisms and ecosystems beyond the limits of their resilience (Frölicher et al., 2018).
Key findings
Annual trends
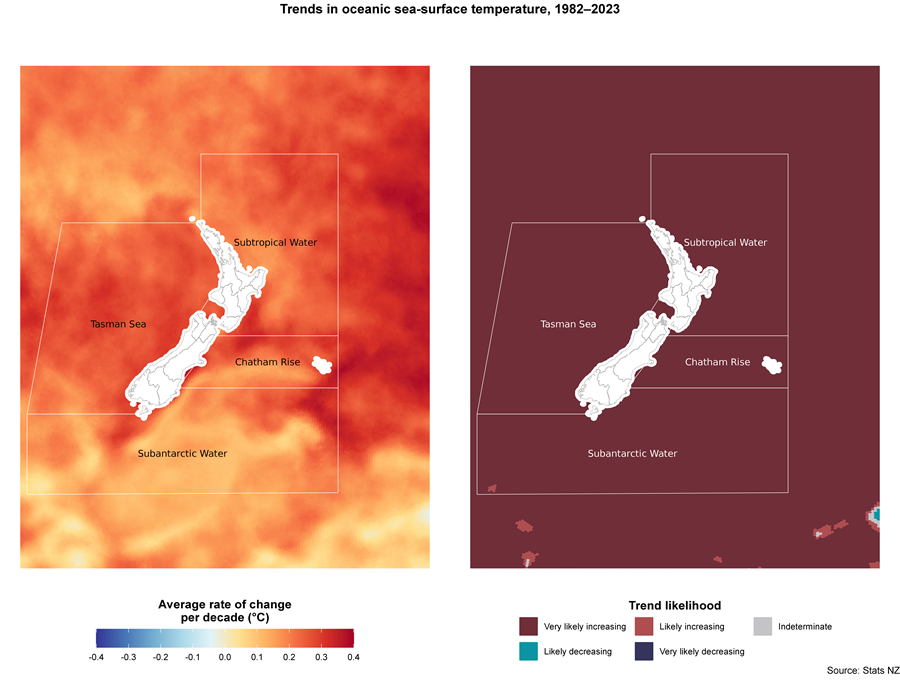
Text alternative for Trends in oceanic sea-surface temperature, 1982-2023
The map on the left shows four oceanic regions of New Zealand, coloured to show the average rate of oceanic sea-surface temperature change per decade in degrees Celsius between 1982 and 2023. The scale ranges from a rate of change of -0.4 degrees Celsius (dark blue) to 0.4 degrees Celsius (red). Red represents positive rates of change meaning that the rate of sea-surface temperature is increasing, while at the other end of the scale dark blue represents negative rates of change meaning that the rate of sea-surface temperature is decreasing. This and the map alongside are overlaid with boundaries for the four oceanic regions: Subtropical Water, Tasman Sea, Chatham Rise, and Subantarctic Water. The map on the right shows the trend likelihood coloured to indicate regions where the trend in oceanic sea-surface temperature is very likely increasing (dark red), likely increasing (light red), indeterminate (grey), likely decreasing (light blue), and very likely decreasing (dark blue). The data is available from Trends in sea-surface temperatures, 1982-2023 (CSV, 2 KB).
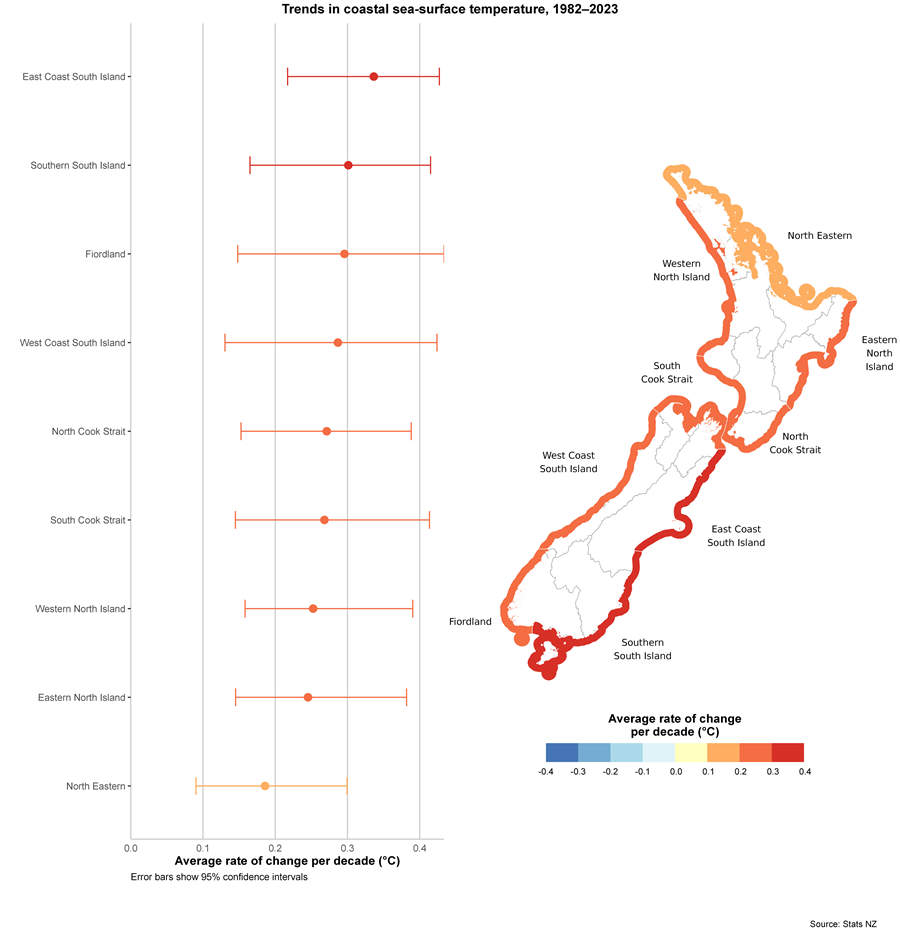
Text alternative for Trends in coastal sea-surface temperature, 1982-2023
The graph (left) and map of New Zealand (right) show the average rate of coastal sea-surface temperature change per decade in degrees Celsius, across nine coastal areas, between 1982 and 2023. The graph on the left shows the average rate of change for each of the nine areas, with each data point represented by a coloured point on the graph. The colours range from orange to red, and all represent positive rates of change meaning that the rate of coastal sea-surface temperature is increasing. In the map on the right, the coastal areas around New Zealand are coloured to show the average rate of change. The scale ranges from a rate of change of -0.4 degrees Celsius (dark blue) to 0.4 degrees Celsius (red). Red represents positive rates of change meaning that the rate of sea-surface temperature is increasing, while at the other end of the scale dark blue represents negative rates of change meaning that the rate of sea-surface temperature is decreasing. The data is available from Trends in sea-surface temperatures, 1982-2023 (CSV, 2 KB).
Overall sea-surface temperatures increased between 1982 and 2023, despite periods and areas of shorter-term warming and cooling.
Between 1982 and 2023:
- sea-surface temperatures increased on average:
- between 0.16 and 0.26 degrees Celsius per decade across the four oceanic regions (Chatham Rise, Tasman Sea, Subtropical, and Subantarctic waters)
- between 0.19 and 0.34 degrees Celsius per decade across the nine coastal regions
- the Tasman Sea had the highest average rate of ocean sea-surface warming (0.26 degrees Celsius per decade)
- East Coast South Island had the highest average rate of coastal sea-surface warming (0.34 degrees Celsius per decade).
Seasonal trends
Between 1982 and 2023, the average rate of sea-surface warming per decade was highest in autumn across:
- three of four oceanic regions (Subantarctic, Subtropical, and the Tasman Sea)
- six of nine coastal regions (Fiordland, North Eastern, South Cook Strait, Southern South Island, West Coast South Island, and Western North Island).
Anomalies
Anomalies are another way of analysing sea-surface temperature. We show annual differences from the climate baseline average (average temperature for a given region) between 1991 and 2020, according to WMO guidelines (World Meteorological Organization, 2017). Annual sea-surface temperature anomalies are generally stable despite seasonal variations.
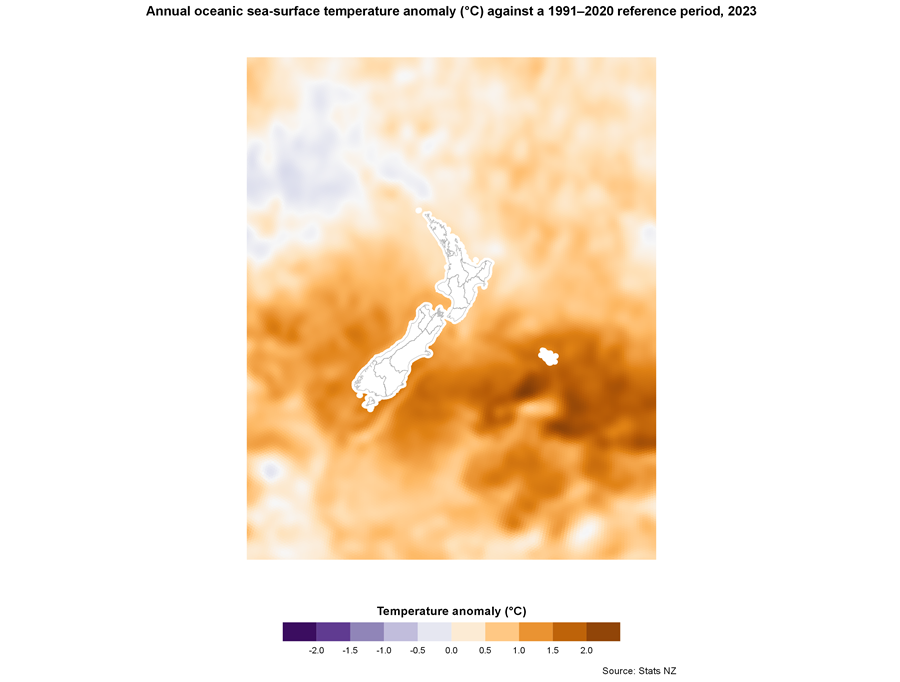
Text alternative for Annual oceanic sea-surface temperature anomaly (°C) against a 1991-2020 reference period, 2023
This map of New Zealand shows average oceanic sea-surface temperature anomalies compared to the 1991-2020 reference period for the 2023 year. The scale ranges from less than -2.0 degrees Celsius (purple) to more than 2.0 degrees Celsius (dark orange). Dark orange represents positive anomalies meaning the average temperature in 2023 is higher than the climate baseline average. Dark purple represents negative anomalies meaning the average temperature in 2023 is lower than the climate baseline average.
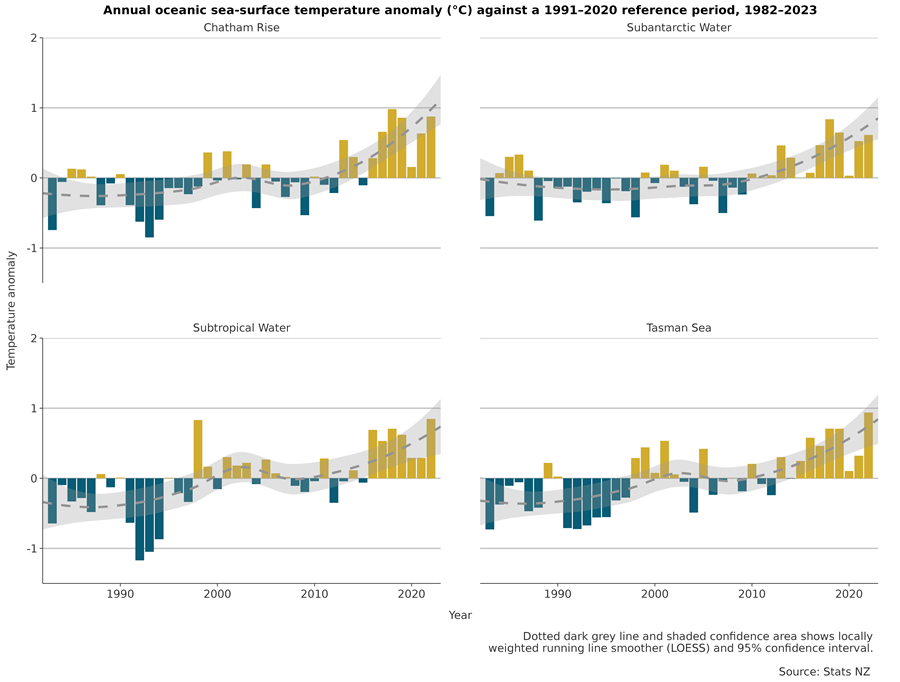
Text alternative for Annual oceanic sea-surface temperature anomaly (°C) against a 1991-2020 reference period, 1982-2023
Four bar charts show annual sea-surface temperature anomalies for the oceanic regions of Chatham Rise, Subantarctic Water, Tasman Sea, and Subtropical Water over the period 1982-2023. Annual anomalies are annual sea-surface temperatures against the 1991-2020 reference period. The data is available from Annual ocean anomalies, 1982-2023 (CSV, 7 KB).
Between 1982 and 2023, each oceanic region had their warmest years recorded in either 2022 or 2023.
Oceanic region |
Year |
Average temperature (°C) |
Anomaly (°C) |
Chatham Rise |
2023 |
14.2 |
+1.3 |
Tasman Sea |
2022 |
16.6 |
+0.9 |
Subtropical Water |
2022 |
19.1 |
+0.8 |
Subantarctic Water |
2023 |
10.6 |
+1.1 |
Between 1982 and 2023, each coastal region had their warmest years recorded in either 2022 or 2023.
Coastal region |
Year |
Average temperature (°C) |
Anomaly (°C) |
North Eastern |
2022 |
18.7 |
+1.1 |
Western North Island |
2022 |
18.3 |
+1.2 |
Eastern North Island |
2023 |
16.8 |
+0.6 |
North Cook Strait |
2022 |
15.8 |
+0.9 |
South Cook Strait |
2022 |
16.5 |
+1.3 |
West Coast South Island |
2022 |
16.2 |
+1.4 |
East Coast South Island |
2023 |
14.2 |
+1.3 |
Southern South Island |
2023 |
13.6 |
+1.5 |
Fiordland |
2022 |
15.0 |
+1.5 |
Marine heatwaves
Marine heatwaves are prolonged events of abnormally warm water that can have significant impacts on marine ecosystems and the services they provide.
| Year | Chatham Rise | Subantarctic Water | Subtropical Water | Tasman Sea |
| 1982 | 2 | 10 | 3 | 2 |
| 1983 | 1 | 2 | 1 | 1 |
| 1984 | 7 | 10 | 6 | 3 |
| 1985 | 14 | 16 | 6 | 4 |
| 1986 | 10 | 17 | 3 | 4 |
| 1987 | 8 | 10 | 2 | 3 |
| 1988 | 1 | 2 | 6 | 3 |
| 1989 | 8 | 12 | 4 | 14 |
| 1990 | 8 | 4 | 8 | 6 |
| 1991 | 2 | 4 | 1 | 0 |
| 1992 | 3 | 4 | 0 | 1 |
| 1993 | 0 | 2 | 0 | 0 |
| 1994 | 3 | 3 | 1 | 2 |
| 1995 | 5 | 2 | 7 | 1 |
| 1996 | 1 | 5 | 3 | 3 |
| 1997 | 5 | 4 | 4 | 5 |
| 1998 | 7 | 1 | 49 | 24 |
| 1999 | 21 | 8 | 14 | 26 |
| 2000 | 5 | 5 | 2 | 10 |
| 2001 | 20 | 14 | 13 | 33 |
| 2002 | 6 | 10 | 9 | 7 |
| 2003 | 11 | 4 | 10 | 4 |
| 2004 | 3 | 2 | 8 | 1 |
| 2005 | 12 | 11 | 18 | 26 |
| 2006 | 9 | 13 | 7 | 2 |
| 2007 | 4 | 1 | 6 | 5 |
| 2008 | 4 | 4 | 2 | 8 |
| 2009 | 3 | 4 | 4 | 2 |
| 2010 | 6 | 10 | 4 | 15 |
| 2011 | 6 | 5 | 16 | 5 |
| 2012 | 2 | 7 | 1 | 2 |
| 2013 | 26 | 27 | 8 | 20 |
| 2014 | 20 | 20 | 11 | 7 |
| 2015 | 6 | 7 | 7 | 18 |
| 2016 | 14 | 15 | 39 | 35 |
| 2017 | 39 | 33 | 27 | 24 |
| 2018 | 56 | 46 | 38 | 36 |
| 2019 | 49 | 36 | 33 | 38 |
| 2020 | 25 | 15 | 24 | 16 |
| 2021 | 44 | 37 | 20 | 30 |
| 2022 | 49 | 35 | 50 | 61 |
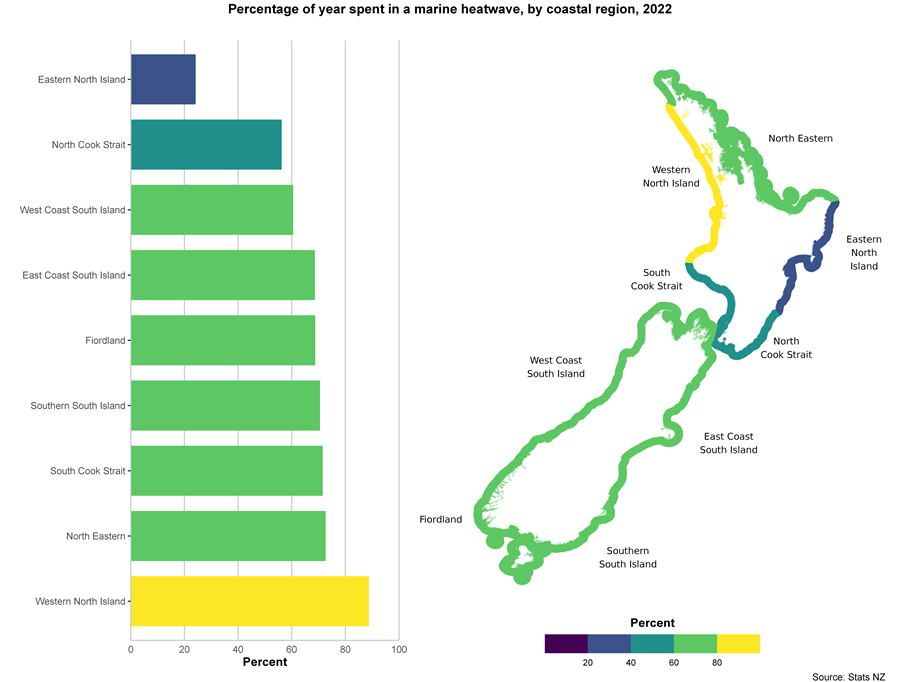
Text alternative for Percentage of year spent in a marine heatwave by coastal region, 2022
The bar graph on the left and the map of New Zealand on the right show the percentage of the year spent in a marine heatwave, by coastal region, in 2022. The scale ranges from less than 20 percent to more than 80 percent. The colours on the map range from purple, which represents lower percentages of the year spent in marine heatwaves, through blue and green to yellow, which represents higher percentages of the year spent in marine heatwaves. The colours on the map are replicated in the bar graph. The data is available from Percent of time in marine heatwave, 2022 (CSV, 0.4 KB).
In 2022:
- the Tasman Sea spent an average of 61.1 percent of the year in marine heatwaves, the longest duration of the four oceanic regions
- the Western North Island spent an average of 88.5 percent of the year in marine heatwaves, the longest duration of the nine coastal regions.
Where this data comes from
National Institute of Water and Atmospheric Research Ltd (NIWA); National Oceanic and Atmospheric Administration (NOAA); National Aeronautics and Space Administration (NASA)
Related indicators
Coastal sea-level rise
New Zealand's greenhouse gas emissions
Coastal and estuarine water quality
Ocean acidification
Marine primary productivity: Data to 2023
Marine non-indigenous species: Data to 2022
Related content
Our marine environment 2022
Environment Aotearoa 2022
Our marine environment 2019
Environment Aotearoa 2019
Sea-surface temperature
Technical report
About the data
Sea-surface temperature (measured in degrees Celsius) refers to the temperature of the uppermost layers of the ocean, which typically varies between approximately 10 and 300 metres in depth. Sea surface-temperature varies between regions and is generally warmer in northern waters and cooler in the southern parts of New Zealand's ocean. Additionally, sea-surface temperature fluctuates over the year, with warmer temperatures in the summer and cooler temperatures in winter (Pinkerton et al., 2023).
Sea-surface temperature is influenced by the balance of several factors, including:
- heating of the upper ocean from the sun during the day
- precipitation (rain) and evaporation from the ocean surface
- heat being transferred between the sea surface and the air
- mixing between the warmer ocean surface layers and cooler deeper water (including by the effect of tides)
- mixing between warm and cold ocean currents (Greig et al., 1988; Pinkerton et al., 2023)
- freshwater input such as river run-off (influencing coastal sea-surface temperature).
Many of these factors, and subsequently sea-surface temperature, are affected by climate cycles, such as El Niño, and long-term changes in the composition of the atmosphere (Sutton & Bowen, 2019; Sutton & Roemmich, 2001). We report on ocean and coastal sea-surface temperature separately because the factors above play out in different ways in coastal waters compared with the open ocean.
We present maps of ocean sea-surface temperature by hexagonal polygons, the majority of which have an area of approximately 288km2. In addition, we report on four oceanic regions that are described in the data, chosen to incorporate specific water masses and productive regions (Pinkerton et al., 2023):
- Subtropical water (warm waters to the northeast of New Zealand)
- the Tasman Sea, including the Subtropical Front west of New Zealand
- the Chatham Rise, including the Subtropical Front east of New Zealand
- Subantarctic water (cold waters to the south of New Zealand).
We also report on nine coastal regions around the north and south islands of New Zealand that are described in the data, based on the New Zealand coastal bioregion analysis (Department of Conservation and Ministry of Fisheries, 2011). These regions extend to the territorial limit of 12 nautical miles offshore (the offshore limit of the Territorial Seas). This selection of coastal regions was considered more biologically meaningful than dividing by regional council boundaries, which was carried out in Pinkerton et al. (2019). This is because regional council boundaries do not necessarily align with oceanography (aspects of what is going on in the coastal ocean), in terms of different physical, chemical, or biological processes in different areas.
The nine coastal regions are:
- North Eastern
- Western North Island
- Eastern North Island
- North Cook Strait
- South Cook Strait
- West Coast South Island
- East Coast South Island
- Southern South Island
- Fiordland.
See Monitoring ocean health: 2023 update on satellite indicators for surface temperature, productivity and suspended solids for more information about the oceanic and coastal regions.
We also report on marine heatwaves for the first time in this indicator. A marine heatwave is defined as occurring when seawater temperature exceeds a seasonally varying threshold (usually the 90th percentile of sea-surface temperature measured during a reference period) for at least five consecutive days (Hobday et al., 2016). See Sea-surface temperature: Data to 2023 - DataInfo+ for more information about marine heatwaves.
We do not report sea-surface temperature for estuaries based on satellite data in this indicator because satellite data often does not have high enough spatial resolution to adequately measure what is happening in estuaries. See coastal and estuarine water quality for estuary temperature state and trends.
Trends
We calculated and report trends using the Theil-Sen slope estimator for:
- average annual trend in sea-surface temperature (units of degree Celsius per decade)
- average seasonal trend in sea-surface temperature (units of degree Celsius per decade).
We calculated annual sea-surface temperature trends for each polygon using annual average data supplied by NIWA. We calculated annual sea-surface temperature trends for each oceanic and coastal region by taking the average of all monthly average values for each complete calendar year (1982 to 2023). We also calculated seasonal sea-surface temperature trends for each oceanic and coastal region by taking the average of all monthly average values for each season where the calendar year was complete (1982 to 2023).
We used an adjusted Mann-Kendall trend test to assess trend direction and likelihood while accounting for autocorrelation. We report trend likelihoods using categories describing the certainty of trends adapted from the Intergovernmental Panel on Climate Change (Mastrandrea et al., 2010). We classify trends as 'likely' when the probability of an increasing or decreasing trend is above 66 percent, and as 'very likely' when the probability is above 90 percent. We use the term 'indeterminate' when there is either no trend direction determined or not enough statistical certainty to determine trend direction (less than 66 percent certainty). Trend likelihood does not take into account the magnitude of the trend and should not be interpreted in isolation from a site's state.
Anomalies
A sea-surface temperature anomaly is the difference between a sea-surface temperature and a baseline temperature, which is typically calculated as the average of 30 years or more of recent temperature data. Observed sea-surface temperatures greater than the baseline temperature are positive anomalies, while those less than the baseline are negative anomalies (National Oceanic and Atmospheric Administration, n.d.). Based on WMO recommendations (WMO, 2017), we report the 1991 to 2020 baseline period, which is likely to be representative of seasonal patterns of sea surface temperature under recent conditions.
Data quality
The accuracy of the data sources is of high quality.
Sea-surface temperature is a direct measure of the 'Sea-level, temperature, and circulation' topic.
Stats NZ and the Ministry for the Environment must report on topics related to the five environmental domains: air, atmosphere and climate, fresh water, land, and marine. These topics identify key issues within each domain.
Topics for environmental reporting describes the topics for each domain.
Data quality has more information about the criteria we use to assess data quality.
References
Department of Conservation & Ministry of Fisheries. (2011). Coastal marine habitats and marine protected areas in the New Zealand Territorial Sea: a broad scale gap analysis. Department of Conservation and the Ministry of Fisheries. https://www.doc.govt.nz/about-us/science-publications/conservation-publications/marine-and-coastal/marine-protected-areas/coastal-marine-habitats-and-marine-protected-areas-in-the-new-zealand-territorial-sea-a-broad-scale-gap-analysis/
Frölicher, T. L., Fischer, E. M., & Gruber, N. (2018). Marine heatwaves under global warming. Nature, 560(7718), 360-364. https://doi.org/10.1038/s41586-018-0383-9
Greig, M. J., Ridgway, N. M., & Shakespeare, B. S. (1988). Sea surface temperature variations at coastal sites around New Zealand. New Zealand Journal of Marine and Freshwater Research, 22(3), 391-400. https://doi.org/10.1080/00288330.1988.9516310
Hobday, A. J., Alexander, L. V., Perkins, S. E., Smale, D., Straub, S. C., Oliver, E. C. J., Benthuysen, J. A., Burrows, M. T., Donat, M. G., Feng, M., Holbrook, N. J., Moore, P. J., Scannell, H. A., Gupta, A. S., & Wernberg, T. (2016). A hierarchical approach to defining marine heatwaves. Progress in Oceanography, 141, 227-238. https://doi.org/10.1016/j.pocean.2015.12.014
Hobday, A. J., Oliver, E. C. J., Gupta, A. S., Benthuysen, J. A., Burrows, M. T., Donat, M. G., Holbrook, N. J., Moore, P. J., Thomsen, M. S., Wernberg, T., & Smale, D. (2018). Categorizing and naming marine heatwaves. Oceanography, 31(2). https://doi.org/10.5670/oceanog.2018.205
Law, C. S., Rickard, G., Fletcher, S. E. M., Pinkerton, M. H., Behrens, E., Chiswell, S. M., & Currie, K. (2017). Climate change projections for the surface ocean around New Zealand. New Zealand Journal of Marine and Freshwater Research, 52(3), 309-335. https://doi.org/10.1080/00288330.2017.1390772
Mastrandrea, M. D., Field, C. B., Stocker, T. F., Edenhofer, O., Ebi, K. L., Frame, D. J., Held, H., Kriegler, E., Mach, K. J., Matschoss, P. R., Plattner, G.-K., Yohe, G. W., & Zwiers, F. W. (2010). Guidance Note for Lead Authors of the IPCC Fifth Assessment Report on Consistent Treatment of Uncertainties. Intergovernmental Panel on Climate Change (IPCC). https://www.ipcc.ch/site/assets/uploads/2018/05/uncertainty-guidance-note.pdf
National Oceanic and Atmospheric Administration. (n.d.). Did you know? Anomalies vs Temperature. https://www.ncdc.noaa.gov/monitoring-references/dyk/anomalies-vs-temperature
Oliver, E. C. J., Donat, M. G., Burrows, M. T., Moore, P. J., Smale, D. A., Alexander, L. V., Benthuysen, J. A., Feng, M., Gupta, A. S., Hobday, A. J., Holbrook, N. J., Perkins‐Kirkpatrick, S. E., Scannell, H. A., Straub, S. C., & Wernberg, T. (2018). Longer and more frequent marine heatwaves over the past century. Nature Communications, 9(1). https://doi.org/10.1038/s41467-018-03732-9
Oliver, E. C. J., Burrows, M. T., Donat, M. G., Gupta, A. S., Alexander, L. V., Perkins‐Kirkpatrick, S. E., Benthuysen, J. A., Hobday, A. J., Holbrook, N. J., Moore, P. J., Thomsen, M. S., Wernberg, T., & Smale, D. (2019). Projected marine heatwaves in the 21st century and the potential for ecological impact. Frontiers in Marine Science, 6. https://doi.org/10.3389/fmars.2019.00734
Pinkerton, M. H. (2017). Impacts of climate change on New Zealand fisheries and aquaculture. In B. F. Phillips & M. Pérez-Ramírez (Eds.), Climate change impacts on fisheries and aquaculture: a global analysis (pp. 91-119). https://doi.org/10.1002/9781119154051.ch5
Pinkerton, M. H., Sutton, P., & Wood, S. (2019). Satellite indicators of phytoplankton and ocean surface temperature for New Zealand. Prepared for the Ministry for the Environment. NIWA Client Report No: 2018180WN. https://environment.govt.nz/publications/satellite-indicators-of-phytoplankton-and-ocean-surface-temperature-for-new-zealand/
Pinkerton, M. H., Gall, M., Thoral, F., Sutton, P., & Wood, S. (2023). Monitoring ocean health: 2023 update on satellite indicators for surface temperature, productivity and suspended solids. Prepared for the Ministry for the Environment. NIWA Client Report No: 2023217WN_rev1. https://environment.govt.nz/publications/monitoring-ocean-health-2023-update-on-satellite-indicators-for-surface-temperature-productivity-and-suspended-solids
Pörtner, H. O., Roberts, D. C., Masson-Delmotte, V., Zhai, P., Tignor, M., Poloczanska, E., Mintenbeck, K., Alegría, A., Nicolai, M., Okem, A., Petzold, J., Rama, B., & Weyer, N. M. (Eds.). (2019). The ocean and cryosphere in a changing climate. A special report of the Intergovernmental Panel on Climate Change. Intergovernmental Panel on Climate Change. https://www.ipcc.ch/site/assets/uploads/sites/3/2019/12/SROCC_FullReport_FINAL.pdf
Smale, D. A., Wernberg, T., Oliver, E. C. J., Thomsen, M. S., Harvey, B. P., Straub, S. C., Burrows, M. T., Alexander, L. V., Benthuysen, J. A., Donat, M. G., Feng, M., Hobday, A. J., Holbrook, N. J., Perkins‐Kirkpatrick, S. E., Scannell, H. A., Gupta, A. S., Payne, B., & Moore, P. J. (2019). Marine heatwaves threaten global biodiversity and the provision of ecosystem services. Nature Climate Change, 9(4), 306-312. https://doi.org/10.1038/s41558-019-0412-1
Smith, K. E., Burrows, M. T., Hobday, A., Gupta, A. S., Moore, P. J., Thomsen, M. S., Wernberg, T., & Smale, D. A. (2021). Socioeconomic impacts of marine heatwaves: Global issues and opportunities. Science, 374(6566). https://doi.org/10.1126/science.abj3593
Stephenson, F., Goetz, K., Sharp, B. R., Mouton, T. L., Beets, F. L., Roberts, J., MacDiarmid, A. B., Constantine, R., & Lundquist, C. J. (2020). Modelling the spatial distribution of cetaceans in New Zealand waters. Diversity and Distributions, 26(4), 495-516. https://doi.org/10.1111/ddi.13035
Stephenson, F., Hamilton, O. N. P., Torres, L. G., Kozmian‐Ledward, L., Pinkerton, M. H., & Constantine, R. (2023). Fine‐scale spatial and temporal distribution patterns of large marine predators in a biodiversity hotspot. Diversity and Distributions, 29(7), 804-820. https://doi.org/10.1111/ddi.13705
Sutton, P. J. H., & Roemmich, D. (2001). Ocean temperature climate off North‐East New Zealand. New Zealand Journal of Marine and Freshwater Research, 35(3), 553-565. https://doi.org/10.1080/00288330.2001.9517022
Sutton, P. J. H., & Bowen, M. (2019). Ocean temperature change around New Zealand over the last 36 years. New Zealand Journal of Marine and Freshwater Research, 53(3), 305-326. https://doi.org/10.1080/00288330.2018.1562945
WCRP Global Sea Level Budget Group (2018). Global sea-level budget 1993-present. Earth System Science Data, 10(3), 1551-1590. https://doi.org/10.5194/essd-10-1551-2018
Willis, T. J., Handley, S. J., Chang, F. H., Law, C. S., Morrisey, D. J., Mullan, A. B., Pinkerton, M., Rodgers, K. L., Sutton, P. J. H., & Tait, A. (2007). Climate change and the New Zealand marine environment (NIWA Client Report: NEL2007-025).
World Meteorological Organization. (2017). WMO guidelines on the calculation of climate normals (WMO-No. 1203). https://library.wmo.int/records/item/55797-wmo-guidelines-on-the-calculation-of-climate-normals
Archived pages
Archived July 2024:
Sea-surface temperature - published October 2019


