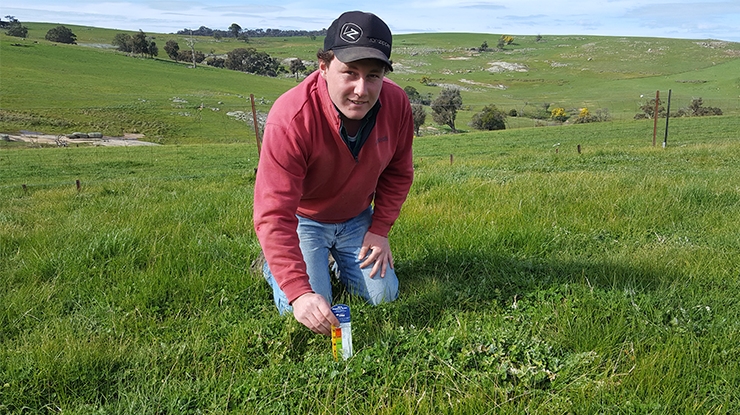
 Tom Plunkett (pictured) completes regular soil tests on his Victorian property. He said his three-step approach helped to make good fertiliser decisions and get the best return on investment.
Optimising pasture growth can be challenging for livestock producers in the picturesque granite hill country in northeast Victoria. High rainfall combined with sandy loam soils means topsoil and sub acidity is an issue.
Nutrients such as phosphorus, potassium, sulphur and molybdenum often limit pasture growth. Determining which soil constraints to correct first and which paddocks are a priority are critical decisions to get the best return on investment.
Three generations of the Plunkett family farm 1,770ha in granite hill country, near Avenel. They run a self-replacing Merino flock and join a portion of Merino ewes to White Suffolk rams.
The Plunketts have increased their use of soil testing to help refine their maintenance fertiliser program and prioritise any capital inputs of fertiliser or lime.
Over the past two years, they have set up fertiliser and lime test strips to see and measure pasture responses to different product options. They have extensively soil tested newly purchased country to develop and prioritise capital expenditure.
The Plunketts are members of the Grasslands Society of Southern (mid-Goulburn branch) Healthy Soils group funded by MLA and coordinated by Lisa Warn.
"We generally take soil tests every two to three years and rotate around the farm," Alan Plunkett said.
"Our usual fertiliser program had been to apply 100 kg/ha of single superphosphate each year but this was just maintaining the Olsen P.
"We have now changed to 80 kg/ha MAP, with sulphur added, and have now seen the Olsen P increasing. We have also been paying more attention to when molybdenum is due.
"The test strips have been a very worthwhile exercise – they show you how much pasture you can grow and you can see the side-by-side response, it is more obvious.
"They indicate how much extra fertiliser might be beneficial and what type is required so we can use that information in our fertiliser budgets.
"We have the soil test information to help plan fertiliser inputs, but the test strip responses give us confidence with what we are doing with the fertiliser program. They have made us more aware of the need for potash fertiliser.
"They have also given us confidence that we can get good fertiliser responses in paddocks we haven't limed yet."

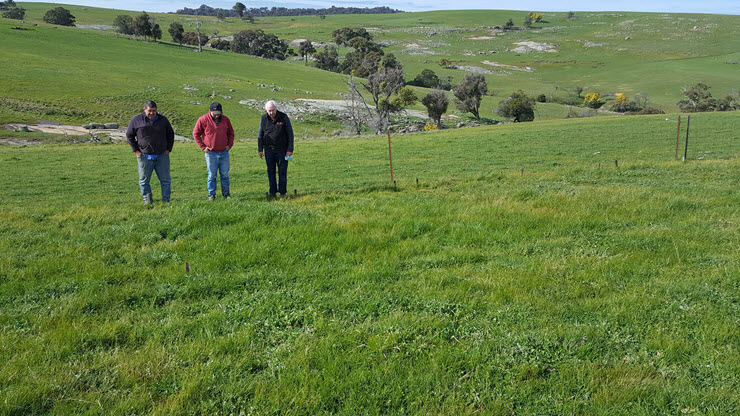
Left to right: Farm manager Trevor Corkell, Tom Plunkett and Alan Plunkett.
In one paddock (mainly annual grasses and sub clover, see Table 1 for soil test results), the strips that received phosphorus/sulphur (P/S) had taller, denser feed and more clover, compared with the 'control' strip (nil fertiliser in 2020).
The test strips that also received potassium (K) had more feed again and also responded better to nitrogen (urea).
It was estimated that an extra 800kg/ha DM was grown (from May to August) using 100kg/ha urea on the PKS strips.
Annual ryegrass responded well and became the dominant annual grass in the strips that received the urea, highlighting the option to use urea to grow more winter feed at a low cost in in paddocks with good soil fertility.
Alan's grandson Tom has also been involved in setting up the test strips and monitoring the responses.
"We have learnt how to interpret soil tests and calculate and prioritise fertiliser requirements in our Healthy Soils group," Tom said.
"The test strips have given us more information than just the soil tests. It is easy to see the benefit of having the right fertiliser.
"I can't see my boots in the strip that got all the nutrients that were limiting but I can see them in the control/nil plot next to it."
The Plunketts' three-step approach to making fertiliser decisions involve:
1. Soil test
A regular soil test program is essential to make good decisions about the choice and rate of fertilisers to use and identify any need for lime or gypsum.
2. Use fertiliser test strips
Fertiliser test strips are a great way to assess the quantity and quality of pasture that could be grown if any nutrient limitations are removed. This can allow a cost-benefit calculation to be done and can help prioritise where you invest your fertiliser budget. Other products like urea, gibberellic acid, lime or gypsum can be included in the strips for assessment.
3. Tissue test
Clover leaf analysis is the best method to determine the need for trace elements like molybdenum or copper.
Table 1. Soil test results for a paddock where test strips were set up in May 2020.
Analysis |
Units |
Test strip paddock |
Critical value / desirable range |
Phosphorus - P (Olsen) |
mg/kg |
8.8 |
12 - 15 |
Potassium - K (Colwell) |
mg/kg |
94 |
150 (loam) |
Sulphur - S (KCl 40) |
mg/kg |
5.3 |
8 - 12 |
pH (1:5 water) |
5.6 |
5.3 - 6.0 |
|
pH (CaCl2) |
4.6 |
4.6 - 5.2 |
|
Organic Carbon |
% |
2.37 |
3 - 5% |
Phosphorus Buffering Index |
PBI |
61.5 |
|
Phosphorus (Colwell) |
mg/kg |
14 |
|
Aluminium % of cations |
7.8% |


