This page explains how we determined the new training window for the international migration model. The training window is the rolling period of historical border crossing data used to train the model for provisional migration estimates. Our goal is to reduce the size of the initial revisions and standard errors by adjusting this window.
Since the international migration model has been operating - starting with the November 2018 provisional migration estimates (published in January 2019) - the training window has been the 36 most recent finalised months.
Starting with the June 2024 provisional migration estimates (to be published on 13 August 2024), Stats NZ will adopt a new training window which includes the 32 most recent finalised months, plus finalised border crossings from the four oldest provisional months. This change in the training window produces smaller standard errors and revisions for provisional estimates. Final migration estimates are unaffected by this change, because in those estimates the migrant status of all travellers is certain and no modelling is required.
How is migration measured?
The outcomes-based measure of migration, with provisional and final estimates, is the official way we measure international migration in New Zealand. To classify a border crossing as a migrant movement, we need to observe up to 16 months of travel after that border crossing. It therefore takes 17 months before final migration estimates are available, using the 12/16-month rule.
We use a machine-learning model to classify travellers whose migrant status is uncertain. The proportion of travellers in each month who have an uncertain migrant status, and thus require modelling, is highest in the most recent months being estimated.
The model learns the features of border crossings that make them more or less likely to be migrant crossings, by looking at historical arrivals and departures for which the migrant status is known (finalised). Since outcome-based measurement has been implemented, a three-year (36-month) rolling window of historical journeys has been used to train the model. The window ends with the most recent month for which migrant status has been finalised. For example, for migration estimates up to May 2024 (published in July 2024), the training window was from February 2020 to January 2023 inclusive.
Revisions and standard errors
Through early 2024, we observed higher than usual revisions (estimates for November 2023 and December 2023) and increased standard errors (estimates for March 2024, April 2024, and May 2024) for the international migration model. This was largely due to the impact of COVID-19 border restrictions (March 2020 to July 2022) on our training window.
For example, the first revision of December 2023 monthly migrant departures was down 31 percent, compared with December 2019 (down 17 percent) and December 2018 (down 11 percent). Table 1 shows the standard errors using March 2024 as an example.
Table 1
| Standard error March 2024 | Range of standard errors March months 2019-2023 | |
| Migrant arrivals | 1,409 | 350-600 |
| Migrant departures | 941 | 150-400 |
| Net migration | 1,517 | 200-700 |
These elevated revisions and standard errors suggest the training data was less representative of current traveller behaviour than in the past. For provisional estimates published in late 2023 to early 2024, the training window spanned the entire period of New Zealand's COVID-19 pandemic-related border restrictions. During the pandemic period, the proportion of border crossings that were migrants was significantly higher than before and after (Figure 1), and this impacted the provisional migration estimates.
The percentage of border crossings classified as migrants or non-migrants between January 2018 and May 2023 has varied:
- From January 2018 to February 2020, 1 to 2 percent of border crossings were migrants.
- From March 2020 to March 2022, migrants ranged from 3 to 43 percent, which reflected greatly reduced short-term (less than 12 months) border crossings rather than more migrants.
- After March 2022, the percentage of migrants ranged between 3 and 6 percent.
Figure 1
| Month-Year | Non-migrants | Migrants |
| Jan-18 | 98 | 2 |
| Feb-18 | 98 | 2 |
| Mar-18 | 98 | 2 |
| Apr-18 | 99 | 1 |
| May-18 | 98 | 2 |
| Jun-18 | 98 | 2 |
| Jul-18 | 98 | 2 |
| Aug-18 | 98 | 2 |
| Sep-18 | 98 | 2 |
| Oct-18 | 98 | 2 |
| Nov-18 | 98 | 2 |
| Dec-18 | 98 | 2 |
| Jan-19 | 98 | 2 |
| Feb-19 | 98 | 2 |
| Mar-19 | 99 | 1 |
| Apr-19 | 99 | 1 |
| May-19 | 98 | 2 |
| Jun-19 | 98 | 2 |
| Jul-19 | 98 | 2 |
| Aug-19 | 98 | 2 |
| Sep-19 | 98 | 2 |
| Oct-19 | 98 | 2 |
| Nov-19 | 98 | 2 |
| Dec-19 | 98 | 2 |
| Jan-20 | 98 | 2 |
| Feb-20 | 98 | 2 |
| Mar-20 | 97 | 3 |
| Apr-20 | 94 | 6 |
| May-20 | 85 | 15 |
| Jun-20 | 81 | 19 |
| Jul-20 | 73 | 27 |
| Aug-20 | 66 | 34 |
| Sep-20 | 63 | 37 |
| Oct-20 | 64 | 36 |
| Nov-20 | 61 | 39 |
| Dec-20 | 59 | 41 |
| Jan-21 | 60 | 40 |
| Feb-21 | 57 | 43 |
| Mar-21 | 59 | 41 |
| Apr-21 | 86 | 14 |
| May-21 | 94 | 6 |
| Jun-21 | 93 | 7 |
| Jul-21 | 92 | 8 |
| Aug-21 | 82 | 18 |
| Sep-21 | 64 | 36 |
| Oct-21 | 64 | 36 |
| Nov-21 | 65 | 35 |
| Dec-21 | 65 | 35 |
| Jan-22 | 72 | 28 |
| Feb-22 | 78 | 22 |
| Mar-22 | 88 | 12 |
| Apr-22 | 94 | 6 |
| May-22 | 95 | 5 |
| Jun-22 | 96 | 4 |
| Jul-22 | 97 | 3 |
| Aug-22 | 97 | 3 |
| Sep-22 | 97 | 3 |
| Oct-22 | 97 | 3 |
| Nov-22 | 97 | 3 |
| Dec-22 | 97 | 3 |
| Jan-23 | 97 | 3 |
| Feb-23 | 96 | 4 |
| Mar-23 | 96 | 4 |
| Apr-23 | 97 | 3 |
| May-23 | 96 | 4 |
Including the months most impacted by COVID-19 (with an unstable migration pattern) in the training data results in high revisions and high standard errors. Excluding the oldest months and including mostly-finalised months, with migration that better reflect post-COVID-19 migration dynamics, could improve the earlier estimates. We conducted experiments to determine a more appropriate training window.
Training window experiment
We explored a range of models with different length and type of training window and compared them with the existing 36-month model:
- 24-month model: rolling training window with 24 months of most recent finalised months.
- 32+4-month model: rolling training window with 32 months of most recent finalised months plus finalised crossing for the four oldest provisional months.
- 36+4-month model: rolling training window with 36 months of most recent finalised months plus finalised crossing for the four oldest provisional months.
- 36-fixed month model: fixed training window with 36 months of finalised months from January 2016 to December 2018.
Key findings
- The 24-month model shows improvements in revisions and standard errors. However, analysis carried out in 2019 (before the 36-month model was implemented) suggested that a 24-month model gives lower accuracy and higher relative errors compared with the 36-month model.
- The 32+4-month model shifts the training window forward by 4 months. Over 99 percent of border crossings have finalised migrant status in the four oldest provisional months, allaying concerns that this model is biased to the simplest travel histories. This reduces the time between the final training month and the first estimation month from 16 to 12 months.
- The 36+4-month model includes three occurrences of 8 months from a year, and four occurrences of the other 4 months. This results in an uneven distribution of training data, with a disproportionate amount of information concentrated in those 4 months.
- The 36-fixed month model produces much higher standard errors than the 36-month model and will not reflect changes in migration patterns as we move further away from the 2016 to 2018 training window.
Comparison of 36-month and 32+4-month rolling training windows
Revisions
Figure 2 shows international migrant estimates by direction for models using the 36-month and the 32+4-month rolling training window, for the November 2023, December 2023, and January 2024 months.
Figure 2
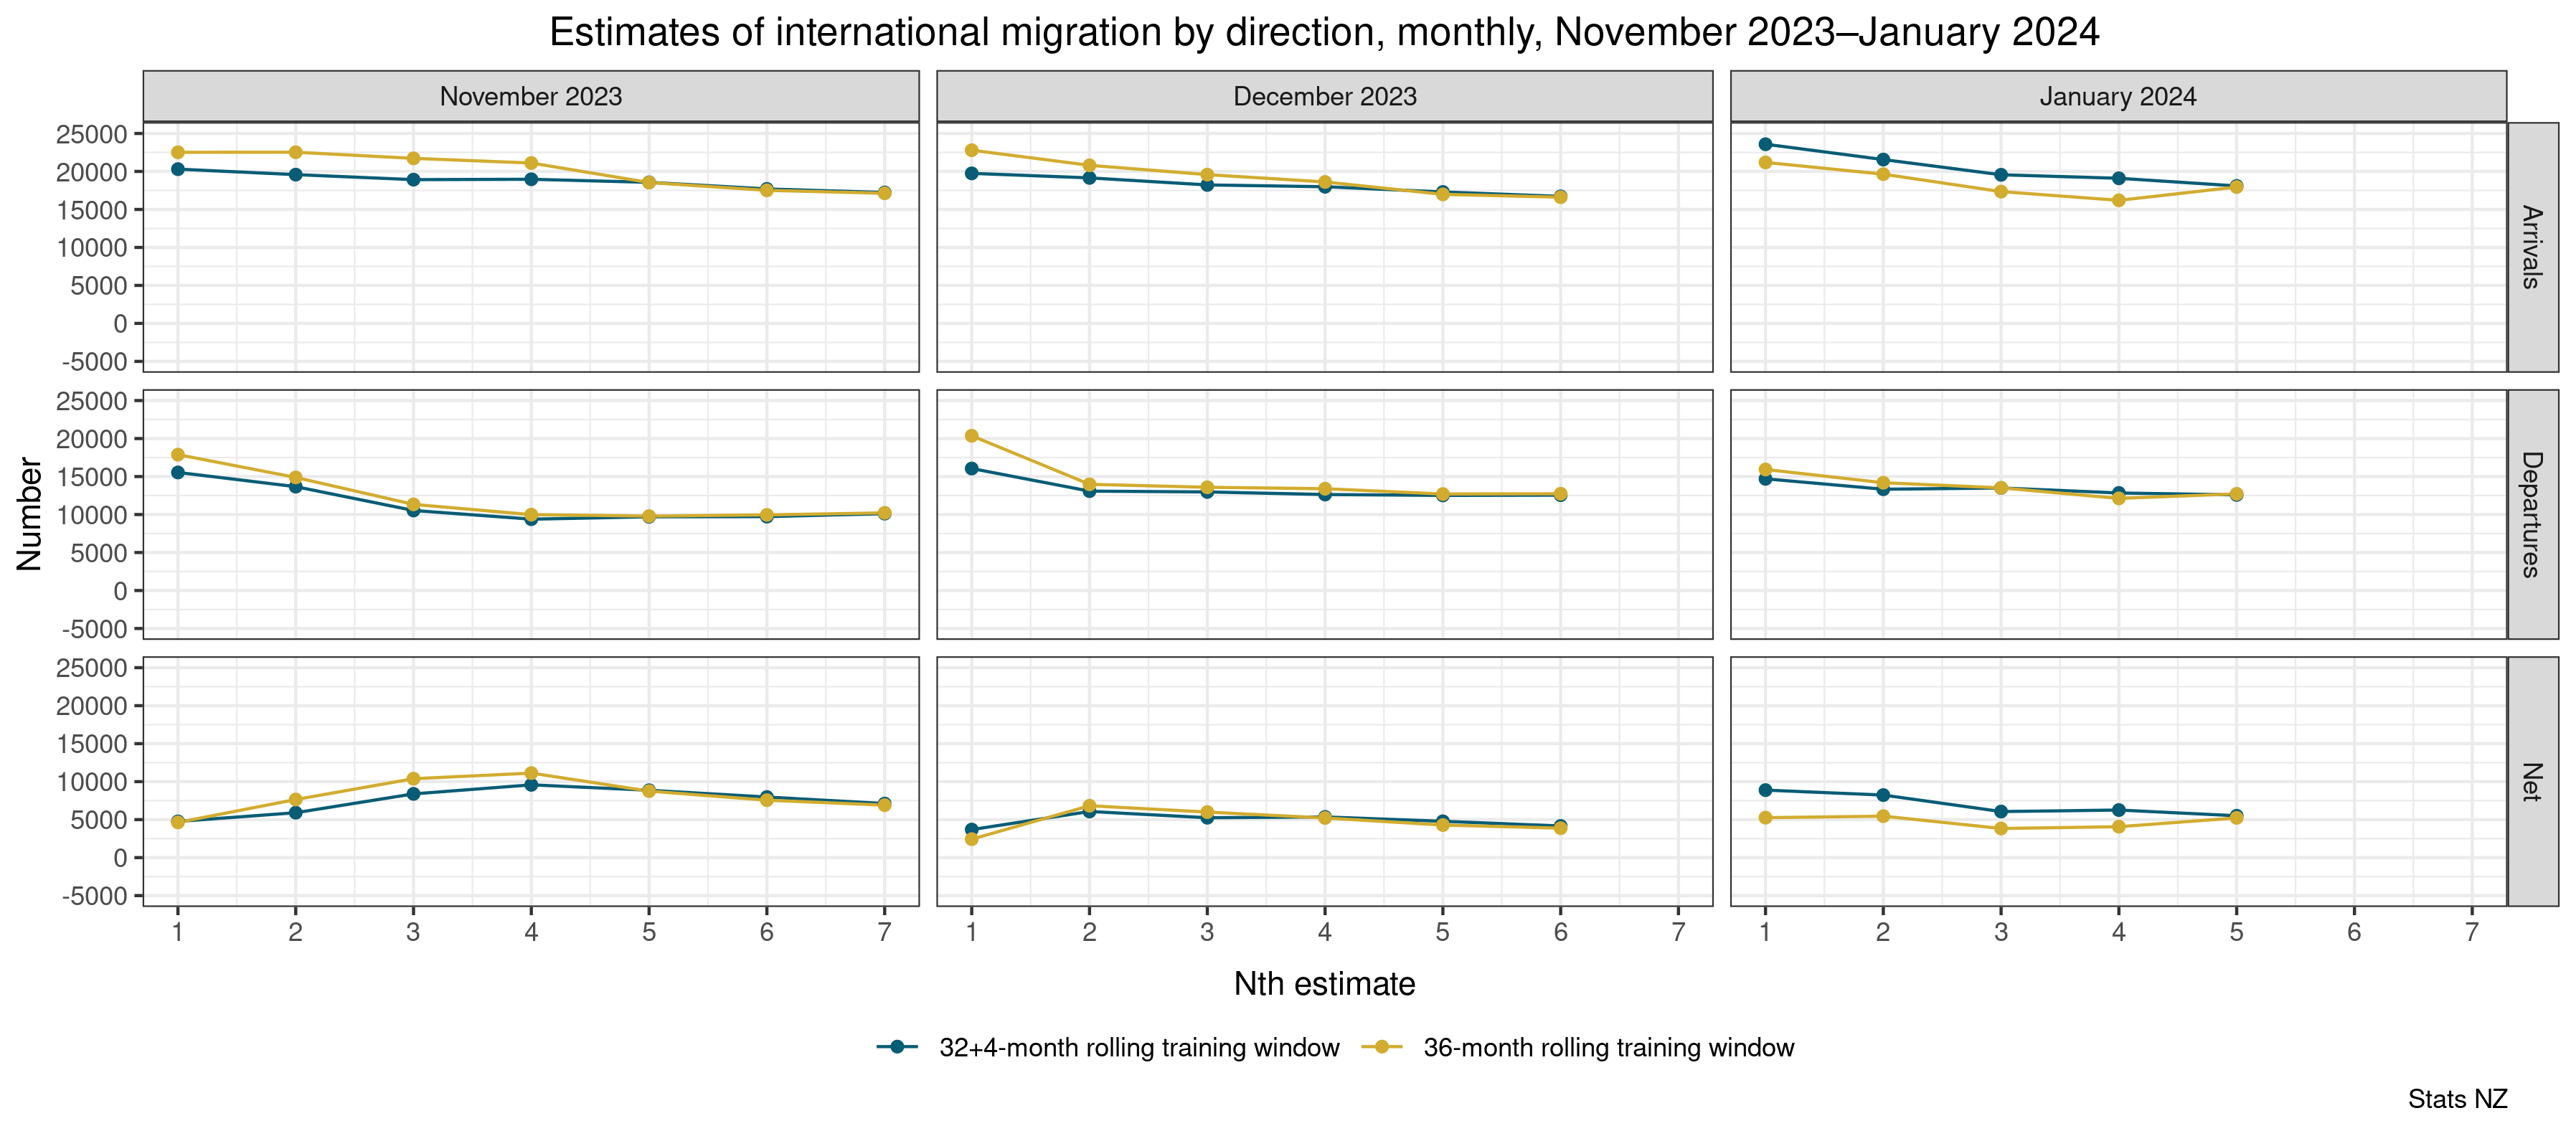
Text alternative for Figure 2 Estimates of international migration by direction, monthly, November 2023-January 2024
The graphs show monthly revisions to provisional migrant arrivals, migrant departures, and net migration for each month from November 2023 to January 2024 using two different training windows. The data is shown in a three-by-three matrix of line graphs where the columns represent November 2023 (left), December 2023 (middle), and January 2024 (right); and the rows represent migrant arrivals (top), migrant departures (middle), and net migration (bottom). The vertical axis shows estimated number of migrants. Time of estimates are labelled on the horizontal axis. Source: Stats NZ.
For November 2023 and December 2023, the model using the 32+4-month rolling training window produces lower estimates of migrant arrivals and departures than the model using the 36-month rolling training window for the first through fourth estimates. For January 2024 arrivals, the model using the 32+4-month rolling training window produces higher estimates than the model using the 36-month rolling training window for the first through fourth estimates.
Estimates are more aligned between the two models from the fifth estimate onwards.
The second estimates of November 2023 departures, December 2023 departures, December 2023 arrivals, and January 2024 departures were closer than the first estimates, indicating smaller revision sizes.
Standard errors
For migrant arrivals, migrant departures, and net migration, the model using the 32+4-month rolling training window produces lower standard errors than the model using the 36-month rolling training window for March, April, and May 2024.
Figure 3
| Month-Year-Direction | 32+4-month rolling training window | 36-month rolling training window |
| Mar-2024 Arrivals | 328 | 1409 |
| Mar-2024 Departures | 266 | 941 |
| Mar-2024 Net | 407 | 1517 |
| Apr-2024 Arrivals | 313 | 1527 |
| Apr-2024 Departures | 265 | 724 |
| Apr-2024 Net | 423 | 1758 |
| May-2024 Arrivals | 326 | 906 |
| May-2024 Departures | 501 | 716 |
| May-2024 Net | 616 | 1142 |
Conclusion
In most cases, using the 32+4-month rolling training window gives smaller revisions and lower standard errors than the model using the 36-month rolling training window. In other periods tested, it performs at least as well as the 36-month rolling training window. Model estimates using 36-month and 32+4-month rolling training window are similar to each other after the fourth estimate.
This change in training window is intended to provide long-term improvements and stability in the accuracy of migration estimates. Regardless of what training window is selected, the timeliness of provisional migration estimates mean that revisions are inevitable.
The 32+4-month rolling training window reduces the size of initial revisions and standard errors and will be used from June 2024 provisional estimates (to be published on 13 August 2024).
Enquiries
Dave Adair
0508 525 525
[email protected]
ISBN 978-1-991307-06-4


