What is measured
UV intensity measures the level of the sun's ultraviolet (UV) light in five places around Aotearoa New Zealand. From north to south, these are Leigh (Auckland region), Paraparaumu (Wellington region), Christchurch (Canterbury region), Lauder (Otago region), and Invercargill (Southland region).
We report the average number of days per year with very high or extreme UV levels for each site between 2004 and 2023, based on the World Health Organization's (WHO) Global Solar UV Index (UVI) guide. We also report the average monthly peak UV index for each site between 2019 and 2023.
Why it is important
The sun's UV radiation can be harmful for many living organisms and ecosystems (Caldwell et al., 1998; Diffey, 1991). For humans, UV exposure helps our bodies make vitamin D, which is essential for healthy bones and muscles. However, too much exposure to UV light can cause sunburn, premature skin ageing, and skin cancer; it can also harm the eyes and weaken the immune system (WHO, 2002).
New Zealand experiences much higher peak UV levels than similar latitudes in the northern hemisphere, and it has one of the highest rates of skin cancer in the world (McKenzie, 2017; The International Agency for Research on Cancer, 2025). Monitoring UV intensity helps us understand its impact on public health.
Key findings
Between 2004 and 2023
The average number of days per year with peak UV intensity at very high or extreme levels (UV index of eight or more) were:
- 137 in Leigh (Auckland region)
- 112 in Paraparaumu (Wellington region)
- 94 in Christchurch (Canterbury region)
- 104 in Lauder (Otago region)
- 71 in Invercargill (Southland region).
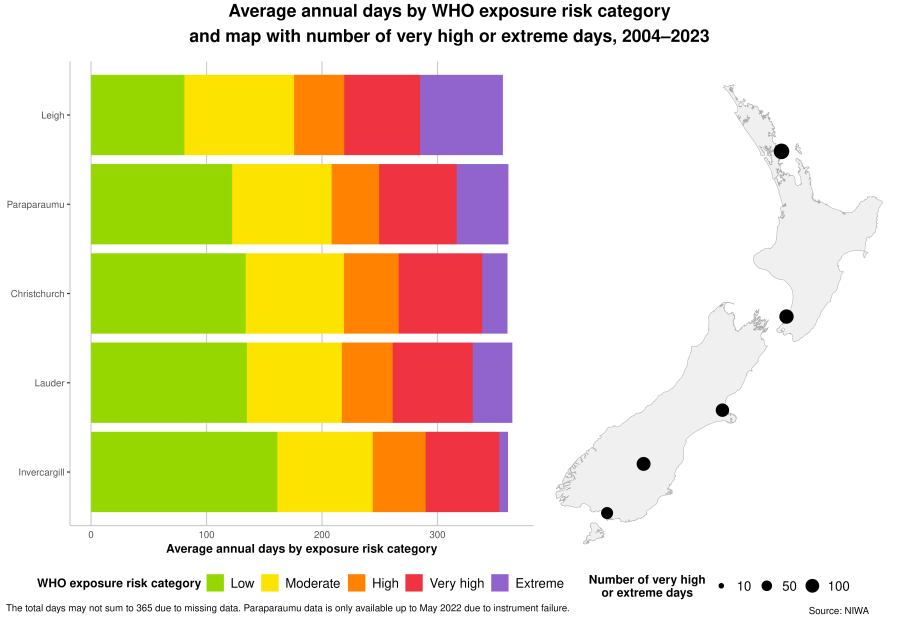
Text alternative for Average annual days by WHO exposure risk category and map with number of very high or extreme days, 2004-2023
The bar graph on the left shows the average annual number of days by WHO UV exposure risk category across five New Zealand locations (Leigh, Paraparaumu, Christchurch, Lauder, and Invercargill) from 2004 to 2023. Each bar is a stacked bar representing one location, with coloured segments showing the average annual days in each WHO UV exposure risk category: low (green), moderate (yellow), high (orange), very high (red), and extreme (purple). The map of New Zealand on the right shows each monitoring site marked with a black dot, with dot size indicating the number of very high or extreme UV days. Larger dots represent more days. The data is available from Average annual days by WHO risk category, 2004-2023 (CSV, 2 KB).
In summer, peak UV indexes are often very high or extreme (eight or more), particularly in the north.
In winter, peak UV indexes are often low (below three), particularly in the south.
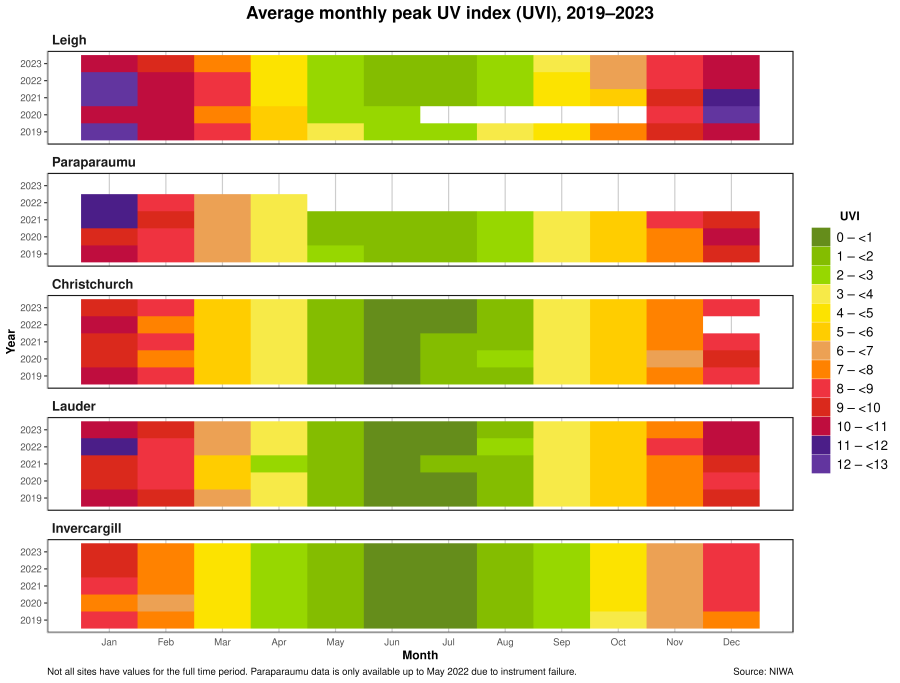
Text alternative for Average monthly peak UV index (UVI), 2019-2023
Five bar graphs show the average monthly peak UV index between 2019 and 2023 for the five monitoring sites. From top to bottom, the sites are arranged geographically from north to south: Leigh, Paraparaumu, Christchurch, Lauder, and Invercargill. Each coloured tile represents the UVI for a specific month and year, with intensity increasing from green (low UVI) to yellow, orange, red, and purple (high UVI). The data is available from Average monthly peak UV index, 2019-2023 (CSV, 9 KB).
Where this data comes from
NIWA (National Institute of Water and Atmospheric Research)
Related indicators
PM₂.₅ concentrations (air quality): Data to 2023
PM₁₀ concentrations (air quality): Data to 2023
Related content
Our atmosphere and climate 2023
Vitamin D Status of New Zealand Adults
Technical report
About the data
New Zealand has naturally high UV levels in summer compared with similar latitudes in the northern hemisphere. For example, our peak UV levels can be 40 percent higher than peak UV levels in similar North American latitudes (McKenzie et al., 2006).
There are three main reasons for the high peak UV level in New Zealand (McKenzie et al., 2006). First, Earth's elliptical orbit means it is closest to the sun during the southern hemisphere summer months of December and January. Second, New Zealand's relatively clean air allows more UV radiation to reach the ground, as there is less scattering by airborne pollution. Third, our atmospheric ozone layer begins to thin over summer. Since ozone in the upper atmosphere plays a crucial role in shielding us from the sun's harmful UV rays, this seasonal thinning allows more UV radiation to reach the ground.
The Antarctic ozone hole, located to the south of New Zealand, has little impact on the country's UV levels (McKenzie, 2017).
Our UV levels are not as extreme as other southern hemisphere locations. For example, UV index values can exceed 20 in Chile, Argentina, and Peru (Liley & Mckenzie, 2007).
NIWA measures UV in five sites around New Zealand. From north to south, these are Leigh (Auckland region), Paraparaumu (Wellington region), Christchurch (Canterbury region), Lauder (Otago region), and Invercargill (Southland region).
UV data are available for Invercargill from 1981, Leigh from 1993, Lauder from 1994, Paraparaumu from 2000, and Christchurch from 2002. All sites have data up to the end of 2023, except Paraparaumu, where the instrument failed in May 2022. The instrument has been repaired and will soon be reinstalled.
The intensity of the sun's UV light is expressed as a solar UV index (UVI). The index values are grouped into five exposure risk categories developed by the World Health Organization (WHO, 2002):
- 0-2: low
- 3-5: moderate
- 6-7: high
- 8-10: very high
- 11+: extreme.
The UV index is an open-ended linear scale, directly proportional to the intensity of solar UV radiation - the higher the value, the greater the potential for skin and eye damage, and the shorter the time it takes for harm to occur.
Daily peak UV levels typically occur during the four-hour period around solar noon. For fair-skinned people, sun protection is necessary when the UV index reaches 3 or above, and outdoor activities should be avoided during midday when the UV index reaches 8 or above (WHO, 2002). While people with darker skin have a lower incidence of skin cancer, they remain susceptible to UV damage, particularly to the eyes and immune system (WHO, 2002).
UV intensity represents the rate at which UV radiation is received. Skin damage depends on total UV dose rather than the dose rate. The dose of the sun's UV radiation is typically expressed in Standard Erythemal Doses (SEDs).
Since UV damage is cumulative, exposure to low UV intensity over a longer period can be just as harmful as exposure to high UV intensity for a short period. Therefore, even when the UV index is below 3, sun protection is still recommended for fair-skinned people who spend extended hours outdoors (McKenzie & Lucas, 2018).
Excessive UV exposure leads to many health risks, but our bodies either need some exposure to UV to be able to make vitamin D, particularly between May and August in New Zealand, or vitamin D supplementation (Ministry of Health & Cancer Society of New Zealand, 2012).
Between 2004 and 2023, we found very likely increasing trends in peak UV level in Lauder and Invercargill and a very likely decreasing trend in Leigh. However, the estimated rate of UVI change per year is small (less than 0.05 per year). Given the natural variability in UV intensity due to factors such as weather patterns and seasonal changes, the rate of change is negligible.
See Revision of UV intensity data for more information about the data.
Data quality
The accuracy of the data source is of high quality.
UV intensity is a partial measure of the 'atmosphere and climate' topic.
Stats NZ and the Ministry for the Environment must report on topics related to the five environmental domains: air, atmosphere and climate, fresh water, land, and marine. These topics identify key issues within each domain.
Topics for environmental reporting describes the topics for each domain.
Data quality has more information about the criteria we use to assess data quality.
References
Caldwell, M., Björn, L., Bornman, J., Flint, S., Kulandaivelu, G., Teramura, A., & Tevini, M. (1998). Effects of increased solar ultraviolet radiation on terrestrial ecosystems. Journal of Photochemistry and Photobiology B Biology, 46(1-3), 40-52. https://doi.org/10.1016/s1011-1344(98)00184-5
Diffey, B. L. (1991). Solar ultraviolet radiation effects on biological systems. Physics in medicine & biology, 36(3), 299. https://iopscience.iop.org/article/10.1088/0031-9155/36/3/001
Liley, J.B. & McKenzie, R.L. (2007). Where on Earth has the highest UV? (PDF, 251 KB). https://www.researchgate.net/publication/306157374_Where_on_Earth_has_the_highest_UV
McKenzie, R. (2017). UV radiation in the melanoma capital of the world: What makes New Zealand so different? AIP Conference Proceedings, 1810, 020003. https://doi.org/10.1063/1.4975499
McKenzie, R., Bodeker, G., Scott, G., Slusser, J., & Lantz, K. (2006). Geographical differences in erythemally-weighted UV measured at mid-latitude USDA sites. Photochemical & Photobiological Sciences, 5(3), 343. http://doi.org/10.1039/b510943d
McKenzie, R. L., & Lucas, R. M. (2018). Reassessing impacts of extended daily exposure to low level solar UV radiation. Scientific Reports, 8(1). https://doi.org/10.1038/s41598-018-32056-3
Ministry of Health & Cancer Society of New Zealand. (2012). Consensus statement on vitamin D and sun exposure in New Zealand. https://www.health.govt.nz/publications/consensus-statement-on-vitamin-d-and-sun-exposure-in-new-zealand
The International Agency for Research on Cancer (IARC). (2025). Cancer today. Retrieved from https://gco.iarc.who.int.
World Health Organization (WHO). (2002). Global solar UV index : a practical guide. https://www.who.int/publications/i/item/9241590076
Archived pages
Archived April 2025:
UV intensity - published October 2017


