What is measured
This indicator measures fire danger potential, using the New Zealand Fire Danger Rating System, at 30 sites around Aotearoa New Zealand from 1997 to 2023, although not all sites start at 1997.
We report the average number of very high or extreme (VHE) fire danger class days per year for 30 sites between 2014 and 2023. Fire danger classes are estimated using two separate fuel types - forest or grass. This allows for consistent comparisons of the number of VHE fire danger days based on potential fuel type.
Fire danger classes provide a broad-scale assessment of the likelihood of wildfires occurring and spreading in an area. VHE fire danger represents significant risk of large wildfire outbreaks that may require much effort to control. Days of VHE fire danger don't necessarily mean a wildfire did, or will, occur. Similarly, wildfires can occur even if the fire danger is not VHE. This is because an ignition source is needed for a wildfire to occur.
We also report annual trends for VHE fire danger days, based on the forest fuel type, for 28 sites between 1997 and 2023.
Why it is important
There were 4,417 wildfires and 4,864 hectares burnt between 1 July 2021 and 30 June 2022. On average, there were 4,683 wildfires per year in the five years to 30 June 2022 (Gross et al., 2024). Wildfires can lead to the loss of biodiversity, economic losses, and loss of life and property. Smoke from wildfires can impact human health through reduced air quality. Wildfire risk in many parts of New Zealand is expected to increase due to higher temperatures, stronger winds, and lower rainfall and humidity associated with climate change (Langer et al., 2021).
Key findings
Fire danger days calculated using forest as the fuel type
In 2023, the most VHE fire danger days (when forest was used as the fuel type) were at Tara Hills, Lake Tekapo, and Queenstown (32, 30, and 19 days, respectively). Data was not available for Waiouru in 2023.
Between 2014 and 2023, the average number of VHE fire danger days was highest:
- at Blenheim, Tara Hills, and Lake Tekapo (38.6, 36.4, and 31.7 days per year, respectively)
- in January with 3 days per month, averaged over all sites
- in February 2020 with 6.8 days, averaged over all sites.
Between 1997 and 2023, the average number of VHE fire danger days:
- likely or very likely increased at 13 sites across New Zealand
- likely or very likely decreased at 8 sites.
Seven sites had indeterminate trends.
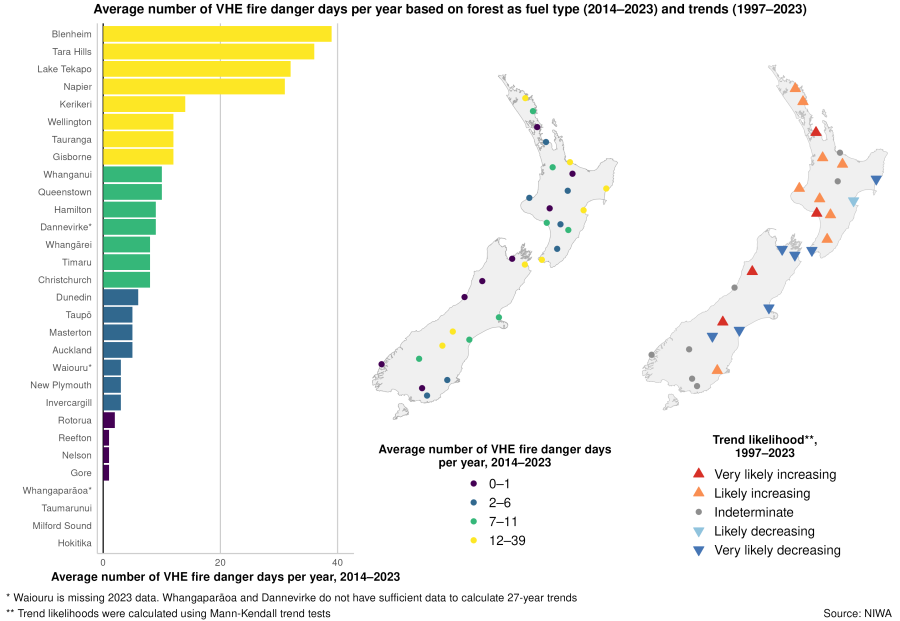
Text alternative for Average number of VHE fire danger days per year based on forest as fuel type (2014-2023) and trends (1997-2023)
The bar graph on the left and the map of New Zealand in the middle show the 10-year average of very high or extreme (VHE) fire danger days per year based on forest fuel at 30 New Zealand sites from 2014 to 2023. The average number of VHE fire danger days per year were 12 to 39 days at Blenheim, Tara Hills, Lake Tekapo, Napier, Kerikeri, Wellington, Tauranga, and Gisborne; 7 to 11 days at Whanganui, Queenstown, Hamilton, Dannevirke, Whangārei, Timaru, and Christchurch; 2 to 6 days at Dunedin, Taupō, Masterton, Auckland, Waiouru, New Plymouth, and Invercargill; and 0 to 1 days at Rotorua, Reefton, Nelson, Gore, Whangaparāoa, Taumarunui, Milford Sound, and Hokitika.
The map of New Zealand on the right shows the longer-term annual trends for the number of VHE fire danger days per year based on forest fuel at 28 New Zealand sites from 1997 to 2023. Trend likelihoods were calculated using Mann-Kendall trend tests. Trend likelihoods were very likely increasing at Auckland, Lake Tekapo, Reefton, and Whanganui; likely increasing at Dunedin, Hamilton, Kerikeri, Masterton, New Plymouth, Rotorua, Taumarunui, Waiouru, and Whangārei; likely decreasing at Napier; very likely decreasing at Blenheim, Christchurch, Gisborne, Nelson, Tara Hills, Timaru, and Wellington; and indeterminate trend at Gore, Hokitika, Invercargill, Milford Sound, Queenstown, Taupō, and Tauranga.
The data is available from Forest VHE wildfire risk: Data to 2023 (CSV, 2 KB).
The percentage of sites in each trend likelihood category changed during the period 1997 to 2023.
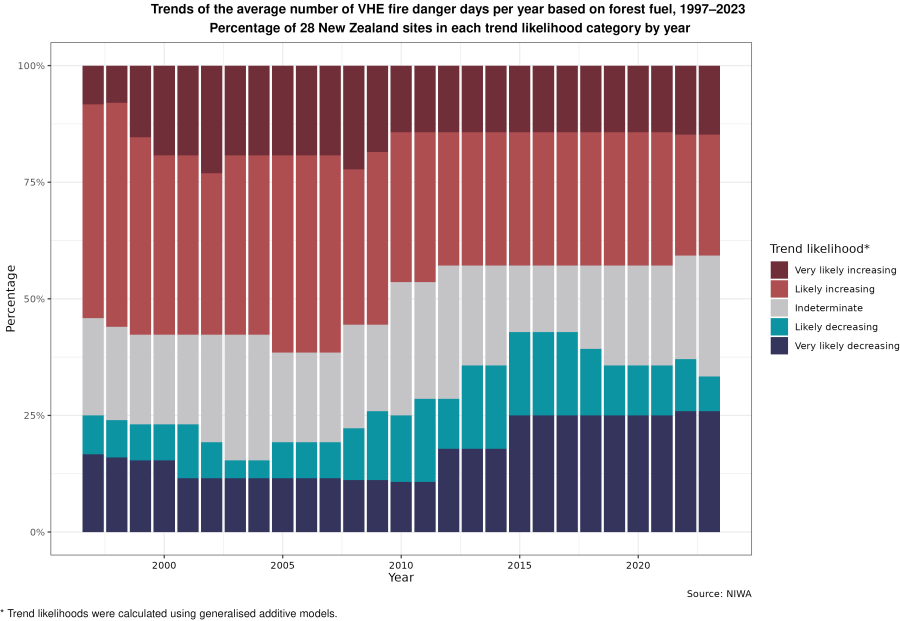
Text alternative for Trends of the average number of VHE fire danger days per year based on forest fuel, 1997-2023
This stacked column graph shows the percentage of 28 New Zealand sites at each trend likelihood category for each year from 1997 to 2023. Trend likelihoods were calculated using generalised additive models. Trend likelihoods are represented by coloured bands to indicate where the trend in the average number of VHE fire danger days per year is very likely increasing (dark red), likely increasing (light red), indeterminate (grey), likely decreasing (light blue), and very likely decreasing (dark blue). The data is available from Trend likelihood percentages by year, 1997-2023 (CSV, 4 KB).
Fire danger days calculated using grass as the fuel type
The vegetation type can have a significant influence on potential fire behaviour, and subsequently fire danger. For this reason, fire danger is often calculated for other fuel types in addition to forest, such as grass.
In 2023, the most VHE fire danger days (when grass was used as the fuel type) were seen at Tara Hills, Lake Tekapo, and Queenstown (20, 16, and 12 days, respectively). Data was not available for Waiouru in 2023.
Between 2014 and 2023, the average number of VHE fire danger days was highest:
- at Napier, Lake Tekapo, and Queenstown (37.9, 20.9, and 19.6 days per year, respectively)
- in January with 1.3 days per month, averaged over all sites
- in January 2017 with 3.3 days, averaged over all sites.
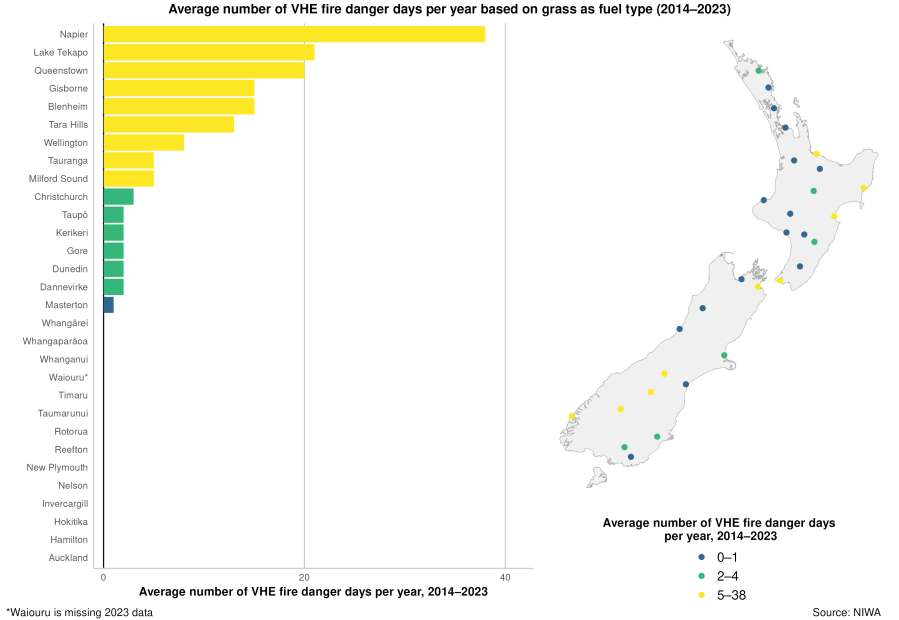
Text alternative for Average number of VHE fire danger days per year based on grass as fuel type (2014-2023)
The bar graph on the left and the map of New Zealand on the right show the 10-year average of very high or extreme (VHE) fire danger days per year based on grass fuel at 30 New Zealand sites from 2014 to 2023. The average number of VHE fire danger days per year were 5 to 28 days at Napier, Lake Tekapo, Queenstown, Gisborne, Blenheim, Tara Hills, Wellington, Tauranga, and Milford Sound; 2 to 4 days at Christchurch, Taupō, Kerikeri, Gore, Dunedin, and Dannevirke; and 0 to 1 days at Masterton, Whangārei, Whangaparāoa, Whanganui, Waiouru, Timaru, Taumarunui, Rotorua, Reefton, New Plymouth, Nelson, Invercargill, Hokitika, Hamilton, and Auckland. The data is available from Grass VHE wildfire risk: Data to 2023 (CSV, 1 KB).
VHE fire danger days higher in summer for forest and grass fuel types
Between 2014 and 2023, the average number of VHE fire danger days per month was generally higher in the summer.
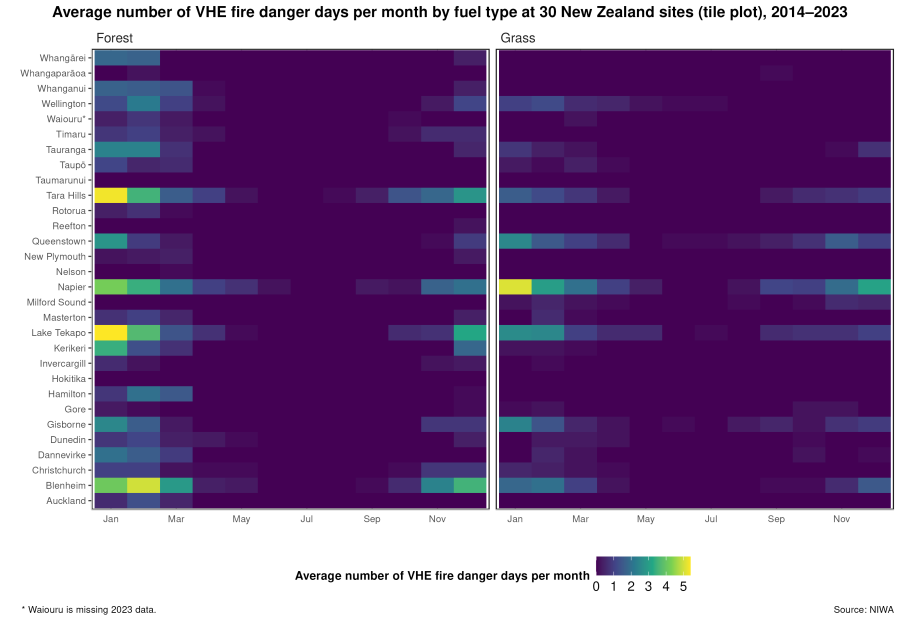
Text alternative for Average number of VHE fire danger days per month by fuel type at 30 New Zealand sites (tile plot), 2014-2023
Two tile graphs are coloured to show the average number of very high or extreme (VHE) fire danger days per month at 30 New Zealand sites from 2014 to 2023. The scale ranges from 0 days (purple) to 5 days (yellow). The graph on the left represents VHE fire danger days based on forest as the fuel type. The graph on the right represents VHE fire danger days based on grass as the fuel type. The data is available from Monthly average VHE days, 2014-2023 (CSV, 31 KB).
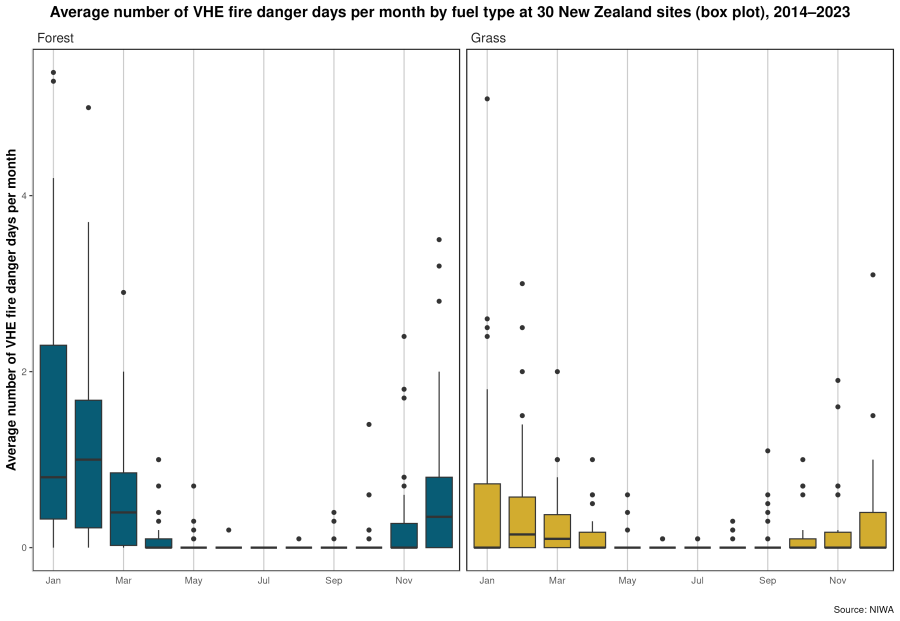
Text alternative for Average number of VHE fire danger days per month by fuel type at 30 New Zealand sites (box plot), 2014-2023
Two box plots summarise the spread in average numbers of very high or extreme (VHE) fire danger days per month across 30 New Zealand sites from 2014 to 2023. The graph on the left, coloured blue, represents VHE fire danger based on forest as the fuel type. The graph on the right, coloured yellow, represents VHE fire danger based on grass as the fuel type. The data is available from Monthly average VHE days, 2014-2023 (CSV, 31 KB).
Where this data comes from
NIWA; Fire and Emergency New Zealand
Related indicators
Related content
Our atmosphere and climate 2023
Our atmosphere and climate 2020
Technical report
Wildfire risk in New Zealand, 1997-2023
About the data
New Zealand's Fire Weather System (FWS), operated by NIWA, is based on the New Zealand Fire Danger Rating System (Anderson, 2005), and is used by Fire and Emergency New Zealand (FENZ) to monitor fire danger in New Zealand. The Fire Danger Rating System produces five classes: low, moderate, high, very high, and extreme. The two highest classes (very high and extreme (VHE)) represent significant risk of large wildfire outbreaks that may require much effort to control. Counts of days when the fire danger is VHE indicates wildfire danger at a location for a given time period and fuel type (Macara & Sutherland, 2024).
The 30 sites in this indicator are located at 30 climate stations for which NIWA provided fire danger ratings from 1997 to 2023, following the methodology described in Macara and Sutherland (2017). NIWA also calculated the monthly and annual number of days at each fire danger rating class level. The number of days were determined from Fire Weather Index System codes and indices (of fuel moisture) and associated fire behaviour potential (fuel consumption, rate of spread, and fire intensity) in the different fuel types using a combination of four weather variables (wind speed, relative humidity, temperature, and 24-hour rainfall - all stored in the National Climate Database hosted by NIWA).
Fuel information for the microclimatic zone represented by each weather station was assigned by FENZ, based on the New Zealand Land Cover Database version 5 and FENZ staff knowledge of the area. For the calculation of fire danger in New Zealand, the topography within each weather station zone is assumed to be flat and the fuel type may be either forest, grass, or scrub.
The calculation of fire danger ratings at each station is done for all three of these fuel types, regardless of whether that fuel type is found at the station (Macara & Sutherland, 2024). This means fire danger ratings used here are estimated. Specific sites will often have a mix of fuel types available to burn in a fire event.
Last time this indicator was published, fire danger was only calculated for the primary fuel type at each station. The change allows for consistent site comparisons of the number of VHE fire danger days based on fuel type. For the grass fuel type, an additional 'grass curing' input was used - an observed percentage of grass that has dried out - from data provided by FENZ based on field observations.
Scrub fire danger ratings were not analysed due to these fuel types being less extensive and the high frequencies of VHE scrub fire dangers compared with the forest and grass fuel types.
Further detail on methodology (including calculations, site selection, and data quality control) is provided in Macara and Sutherland (2024) and Macara and Sutherland (2017).
We report the average annual and average monthly number of VHE fire danger days for each of the 30 sites from 2014 to 2023, calculated using forest and grass as the fuel types. Fire danger based on forest and grass better represents the wildfire risk across the 30 sites, since forest and grass are commonly found at or near each site. Only years with no missing data were considered.
Criteria used to select the 30 climate stations are described in Macara and Sutherland (2024). Climate data for each site is representative of the climate station where it was measured, not the climate of the whole region. Other indicators using the same 30 locations (but not necessarily the same climate stations) in this series are temperature, frost and growing degree days, drought, rainfall, extreme rainfall, and extreme wind.
We report trends for the number of VHE fire danger days per year from 1997 to 2023, based on forest as the fuel type only. We don't report trends for fire danger based on grass, because the additional grass curing input is based on observation meaning data quality may vary from across sites and years. Trends are calculated for 27 years (the longest period available) using two methods:
- Adjusted Mann-Kendall trend tests were used to assess overall trend direction and likelihood (while accounting for autocorrelation) for 28 sites. Sites were only included if they had at least 80 percent of complete years across the time series.
- Generalised additive models (GAMs) were used in this indicator for the first time. GAMs were used to estimate smooth trends over years for 28 sites to show how the trend in the average number of VHE fire danger days, based on forest as the fuel, changes between 1997 and 2023. No other variables were used in the model. We used the mgcv R package (Wood, 2011) to calculate the GAMs using the default settings and used negative binomial as the distribution family, which is appropriate for modelling count data. GAMs for Hokitika and Milford Sound were not calculated because the sites had no VHE fire danger days based on forest fuel.
An increasing trend means that fire danger increased over time, while a decreasing trend means fire danger decreased. Trends reported in this indicator may be different from those reported previously and may change in future updates as more data are recorded and included in the series. Changes in trends are likely due to changes in rainfall, temperature, wind speed, and relative humidity. Natural modes of climate variability, such as the El Niño-Southern Oscillation, might be impacting weather patterns, and therefore fire danger trends, in the last few decades.
We report trend likelihoods using categories describing the certainty of trends adapted from the Intergovernmental Panel on Climate Change (Mastrandrea et al., 2010). We classify trends as 'likely' when the probability of an increasing or decreasing trend is above 66 percent, and as 'very likely' when the probability is above 90 percent. We use the term 'indeterminate' when there is either no trend direction determined or not enough statistical certainty to determine trend direction (less than 66 percent certainty). Trend likelihood does not take into account the magnitude of the trend and should not be interpreted in isolation from a site's state.
The estimates of VHE fire danger days presented here are climate station specific, and not necessarily representative of fire danger in nearby areas. Days of VHE fire danger don't necessarily mean a wildfire did or will occur. Similarly, wildfires can occur even if the fire danger is not VHE.
Data quality
The accuracy of the data source is of high quality.
Wildfire risk is a partial measure of the 'Climate' topic.
Stats NZ and the Ministry for the Environment must report on topics related to the five environmental domains: air, atmosphere and climate, fresh water, land, and marine. These topics identify key issues within each domain.
Topics for environmental reporting describes the topics for each domain.
Data quality has more information about the criteria we use to assess data quality.
References
Anderson, S. (2005). Forest and rural fire danger rating in New Zealand. In M Colley (Ed.), Forestry Handbook (pp, 241-244).
Gross, S., Aguilar-Arguello, S., Woods, D., & Clifford, V. (2024). 2021/2022 New Zealand Wildfire Summary. Fire and Emergency New Zealand Publication. https://www.fireandemergency.nz/assets/Documents/Research-and-reports/Wildfire-Annual-Summary-2021_2022-v2.pdf
Langer, E. R., Wegner, S., Pearce, G., Melia, N., Luff, N., & Palmer, D. (2021). Adapting and mitigating wildfire risk due to climate change: extending knowledge and best practice. (Scion report for Ministry for Primary Industries). https://www.ruralfireresearch.co.nz/?a=80922
Macara, G., & Sutherland, D. (2017). Fire risk assessment: A measure to quantify fire risk for New Zealand locations. NIWA Client Report No. 2017187WN. https://www.mfe.govt.nz/publications/environmental-reporting/fire-risk-assessment-measure-quantify-fire-risk-new-zealand
Macara, G., & Sutherland, D. (2024). Wildfire risk in New Zealand, 1997-2023: Prepared for Ministry for the Environment. NIWA Client Report No. 2024295WN. https://environment.govt.nz/publications/wildfire-risk-in-new-zealand-1997-2023
Mastrandrea, M. D., Field, C. B., Stocker, T. F., Edenhofer, O., Ebi, K. L., Frame, D. J., Held, H., Kriegler, E., Mach, K. J., Matschoss, P. R., Plattner, G.-K., Yohe, G. W., & Zwiers, F. W. (2010). Guidance Note for Lead Authors of the IPCC Fifth Assessment Report on Consistent Treatment of Uncertainties. Intergovernmental Panel on Climate Change (IPCC). https://www.ipcc.ch/site/assets/uploads/2018/05/uncertainty-guidance-note.pdf
Wood, S. N. (2011). Fast stable restricted maximum likelihood and marginal likelihood estimation of semiparametric generalized linear models. Journal of the Royal Statistical Society (B), 73(1), 3-36. https://doi.org/10.1111/j.1467-9868.2010.00749.x
Archived pages
Archived April 2025:
Wildfire risk - published October 2020


